. 2007 Oct 22;4(16):879-91.
doi: 10.1098/rsif.2007.1100.

When individual behaviour matters: homogeneous and network models in epidemiology

Affiliations

When individual behaviour matters: homogeneous and network models in epidemiology

Shweta Bansal et al. J R Soc Interface. .

Abstract

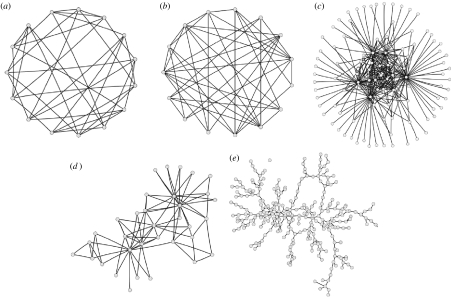
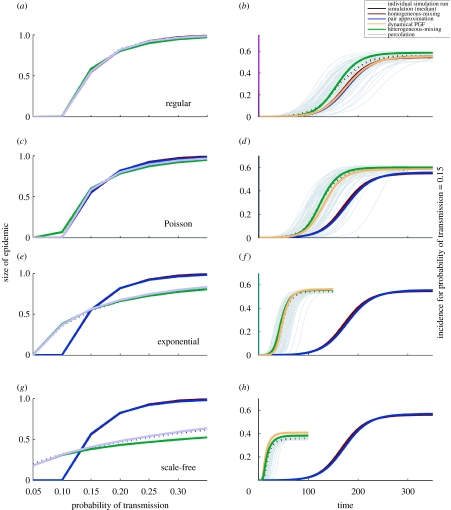
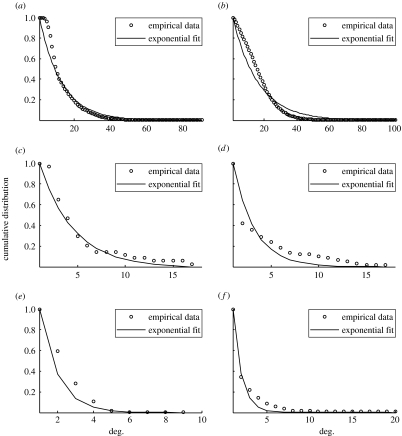
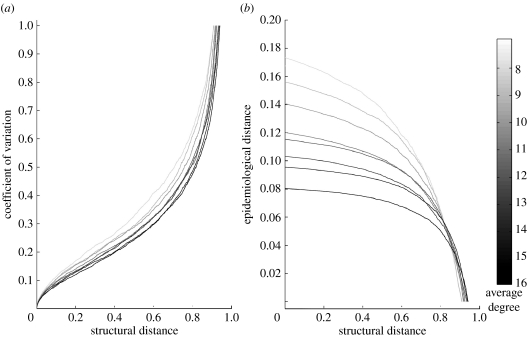
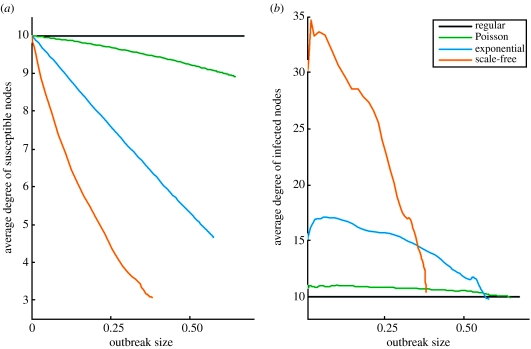
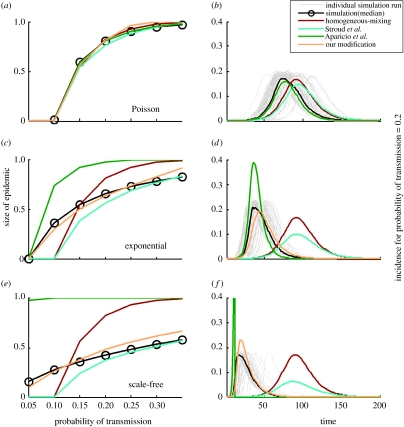
Heterogeneity in host contact patterns profoundly shapes population-level disease dynamics. Many epidemiological models make simplifying assumptions about the patterns of disease-causing interactions among hosts. In particular, homogeneous-mixing models assume that all hosts have identical rates of disease-causing contacts. In recent years, several network-based approaches have been developed to explicitly model heterogeneity in host contact patterns. Here, we use a network perspective to quantify the extent to which real populations depart from the homogeneous-mixing assumption, in terms of both the underlying network structure and the resulting epidemiological dynamics. We find that human contact patterns are indeed more heterogeneous than assumed by homogeneous-mixing models, but are not as variable as some have speculated. We then evaluate a variety of methodologies for incorporating contact heterogeneity, including network-based models and several modifications to the simple SIR compartmental model. We conclude that the homogeneous-mixing compartmental model is appropriate when host populations are nearly homogeneous, and can be modified effectively for a few classes of non-homogeneous networks. In general, however, network models are more intuitive and accurate for predicting disease spread through heterogeneous host populations.


Figures

Figure 1
Figure 1
Examples of (a) a regular random network with 15 nodes and mean=5, (b) a Poisson random graph with 15 nodes and mean=5, (c) a scale-free random graph with 100 nodes and mean=5, (d) the Zachary Karate Club contact network (Zachary 1977) with 34 nodes and mean≈5 and (e) the sexual network for adolescents in a Midwestern US town, with 287 nodes and mean≈2. (These networks do not contain spatial information, and the layouts were chosen simply to facilitate visual comparisons.)
Figure 2
Figure 2
A comparison of the homogeneous-mixing compartmental and network models on various random networks. The networks each have 10 000 nodes and a mean degree of 10, with regular, Poisson, exponential and scale-free degree distributions, respectively. (b,d,f,h) Grey lines, individual simulation runs; dotted black line, the median of values from the simulations. The homogeneous-mixing model is as described in §3. The four network-based models are the pair approximation model (Keeling 1999), percolation model (Newman 2002), heterogeneous-mixing model (Moreno et al. 2002) and dynamical PGF model (Volz in press). In (a,c), all curves overlap. In (b), curves for homogeneous-mixing, pair approximation and dynamical PGF overlap. In (dh), curves for homogeneous-mixing and pair approximation overlap. In (e,g), curves for dynamical PGF and percolation completely overlap. (Percolation does not provide dynamical predictions and is thus not graphed in (b), (d), (f) or (h).)
Figure 3
Figure 3
Statistical fitting of empirical datasets: (a) Vancouver urban network (Meyers et al. 2005), (b) Portland urban network (Eubank et al. 2004; Del Valle et al. 2006), (c) Zachary Karate Club network (Zachary 1977), (d) Atlanta high school syphilis network (Rothenberg et al. 1998), (e) Midwest town adolescents network (Bearman et al. 2004), and (f) Colorado Springs risk network (Potterat et al. 2002). All datasets fit best to the exponential distribution with the parameter values given as follows: (a) λ=13.11±9.9×10⁻³, (b) λ=15.94±2.2×10⁻⁶, (c) λ=4.07±7.8×10⁻³, (d) λ=2.72±1.4×10⁻², (e) λ=1.46±2.8×10⁻², and (f) λ=1.47±2.8×10⁻² (along with standard error in the parameter estimate).
Figure 4
Figure 4
(a) Structural distance (measured as the probability of an edge to be rewired) versus the coefficient of variation (CV). (b) Structural distance versus epidemiological distance, measured as relative difference in predictions for the final size (S) of epidemic for the current network and the target (exponential) network ScurrentStarget/Starget. Both plots include several lines corresponding to different mean degrees, from 8 to 16 (from grey to black, respectively). The number of rewirings required to reach a CV of 1 increases with the mean of the network. All epidemiological calculations in (b) assume the probability of transmission T=0.25.
Figure 5
Figure 5
The average degree among currently (a) susceptible and (b) infected/infectious nodes for various networks. Each network has 10 000 nodes having a regular, Poisson, exponential or scale-free degree distributions, each with a mean of 10. Values are averaged across 50 simulation runs. The x-axis gives the cumulative incidence (1−S/N).
Figure 6
Figure 6
Epidemiological predictions with ‘modifications’ to the homogeneous-mixing compartmental model on three classes of networks. The networks each have 10 000 nodes and a mean degree of 10, with Poisson, exponential and scale-free degree distributions, respectively. (b,d,f) Grey lines, individual simulation runs; black line, the median of values from the simulations. ‘Homogeneous-mixing’ refers to the homogeneous-mixing compartmental model described in §3. Predictions from the modifications by Aparicio & Pascual (2007) and Stroud et al. (2006) are shown. ‘Our modification’ refers to the modified force of infection parameter (λt) described in §5.2.

Similar articles

Cited by

References

    1. Addy C.L, Longini I.M, Harber M. A generalized stochastic model for the analysis of infectious disease final size data. Biometrics. 1991;47:961–974. doi: 10.2307/2532652. - DOI - PubMed
    1. Albert R, Jeong H, Barabasi A.-L. The diameter of the World Wide Web. Nature. 1999;401:130–131. doi: 10.1038/43601. - DOI
    1. Amaral L.A.N, Scala A, Barthelemy M, Stanley H.E. Classes of small-world networks. Proc. Natl Acad. Sci. USA. 2000;97:11 149–11 152. doi: 10.1073/pnas.200327197. - DOI - PMC - PubMed
    1. Anderson R.M, May R.M. Age-related changes in the rate of disease transmission: implications for the design of vaccination programmes. J. Hyg. (Lond.) 1985;94:365–436. - PMC - PubMed
    1. Anderson R.M, May R.M. Oxford University Press; New York, NY: 1992. Infectious diseases of humans: dynamics and control.

Publication types

LinkOut - more resources