. 2007 Sep 21;282(38):27875-86.
doi: 10.1074/jbc.M704055200. Epub 2007 Jul 19.

Gangliosides and Nogo receptors independently mediate myelin-associated glycoprotein inhibition of neurite outgrowth in different nerve cells

Affiliations

Gangliosides and Nogo receptors independently mediate myelin-associated glycoprotein inhibition of neurite outgrowth in different nerve cells

Niraj R Mehta et al. J Biol Chem. .

Abstract

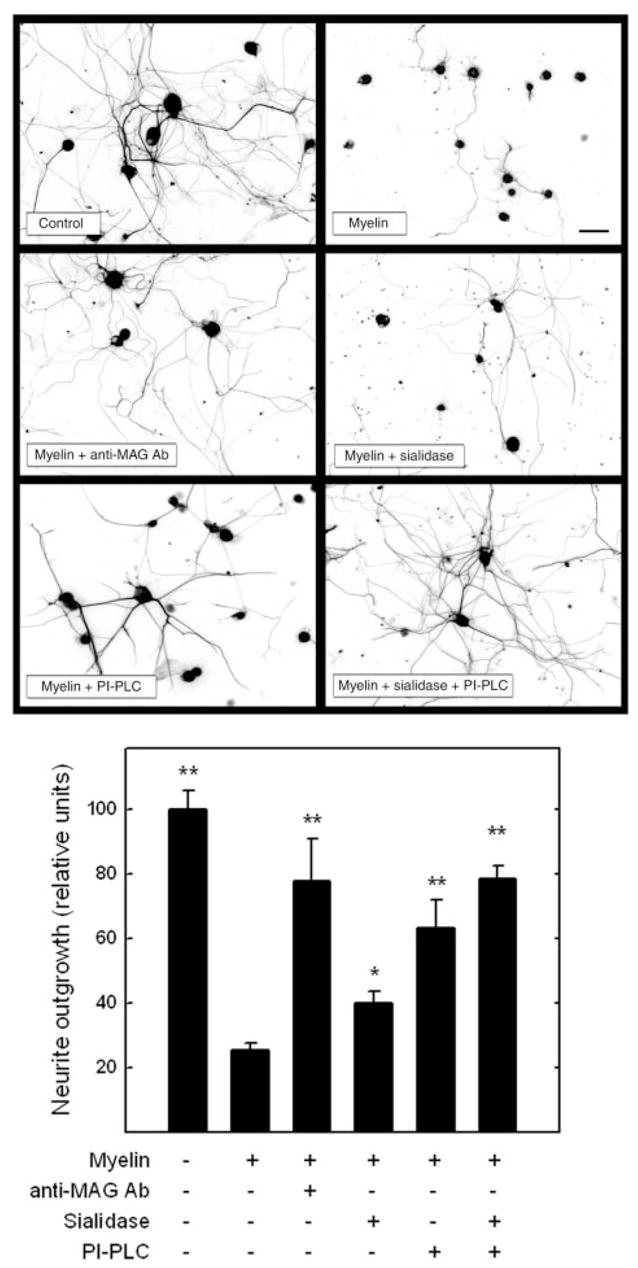
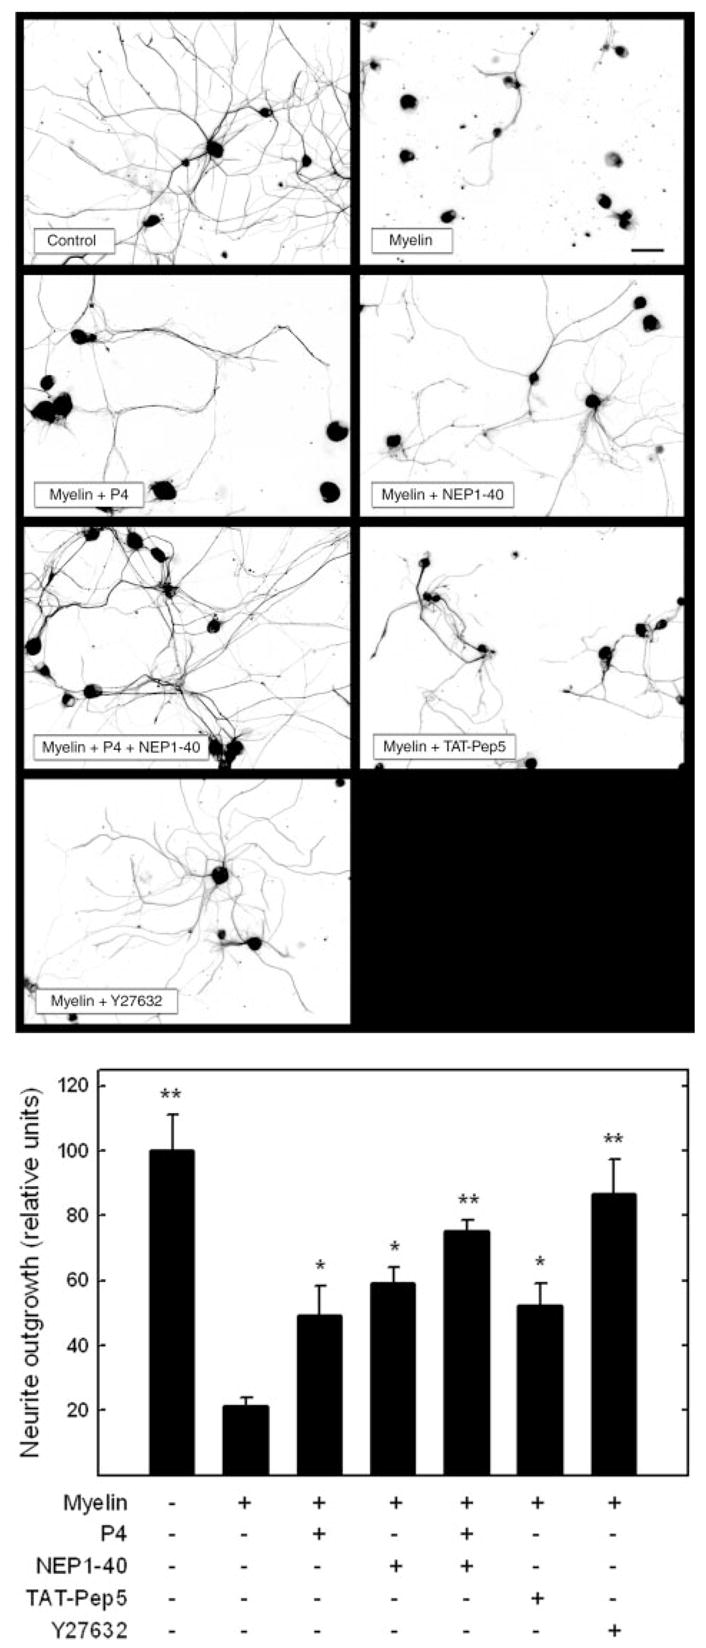
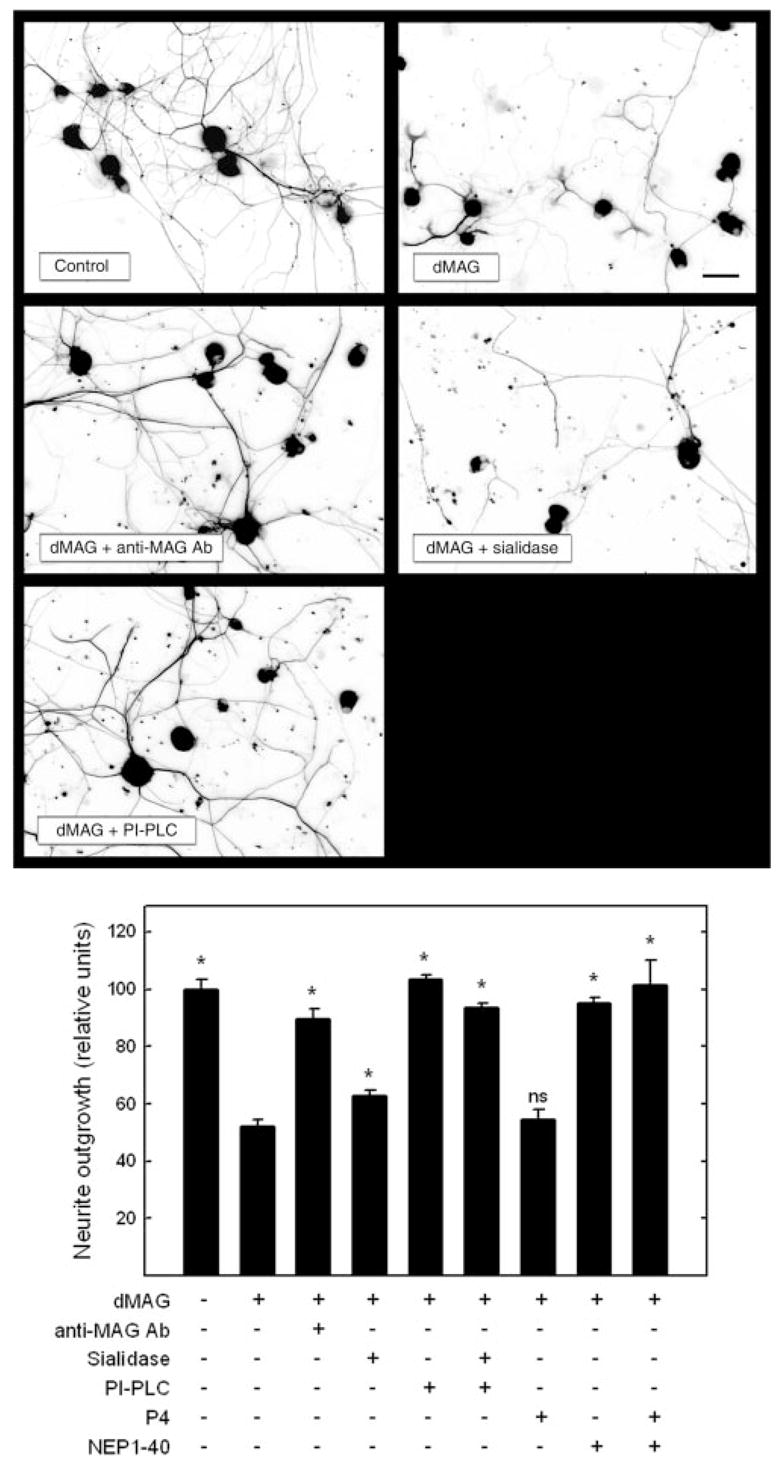
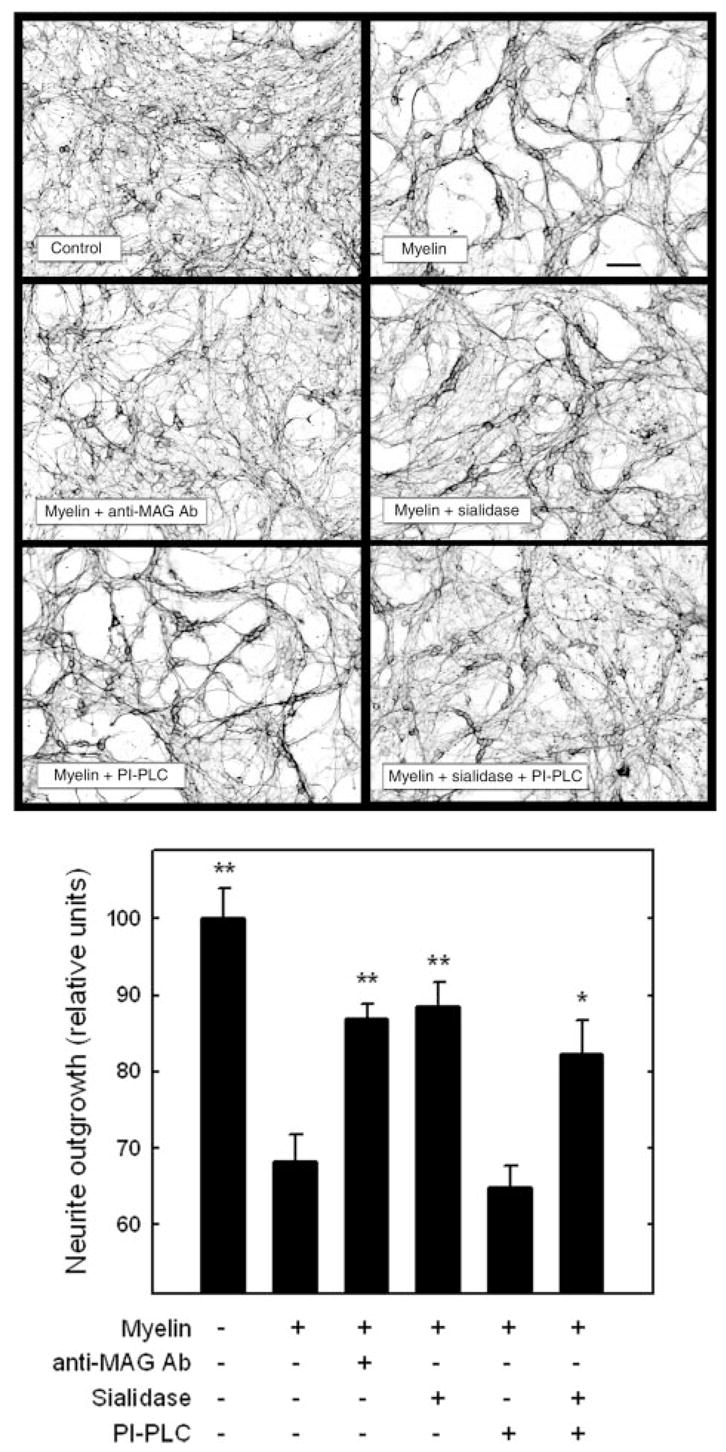
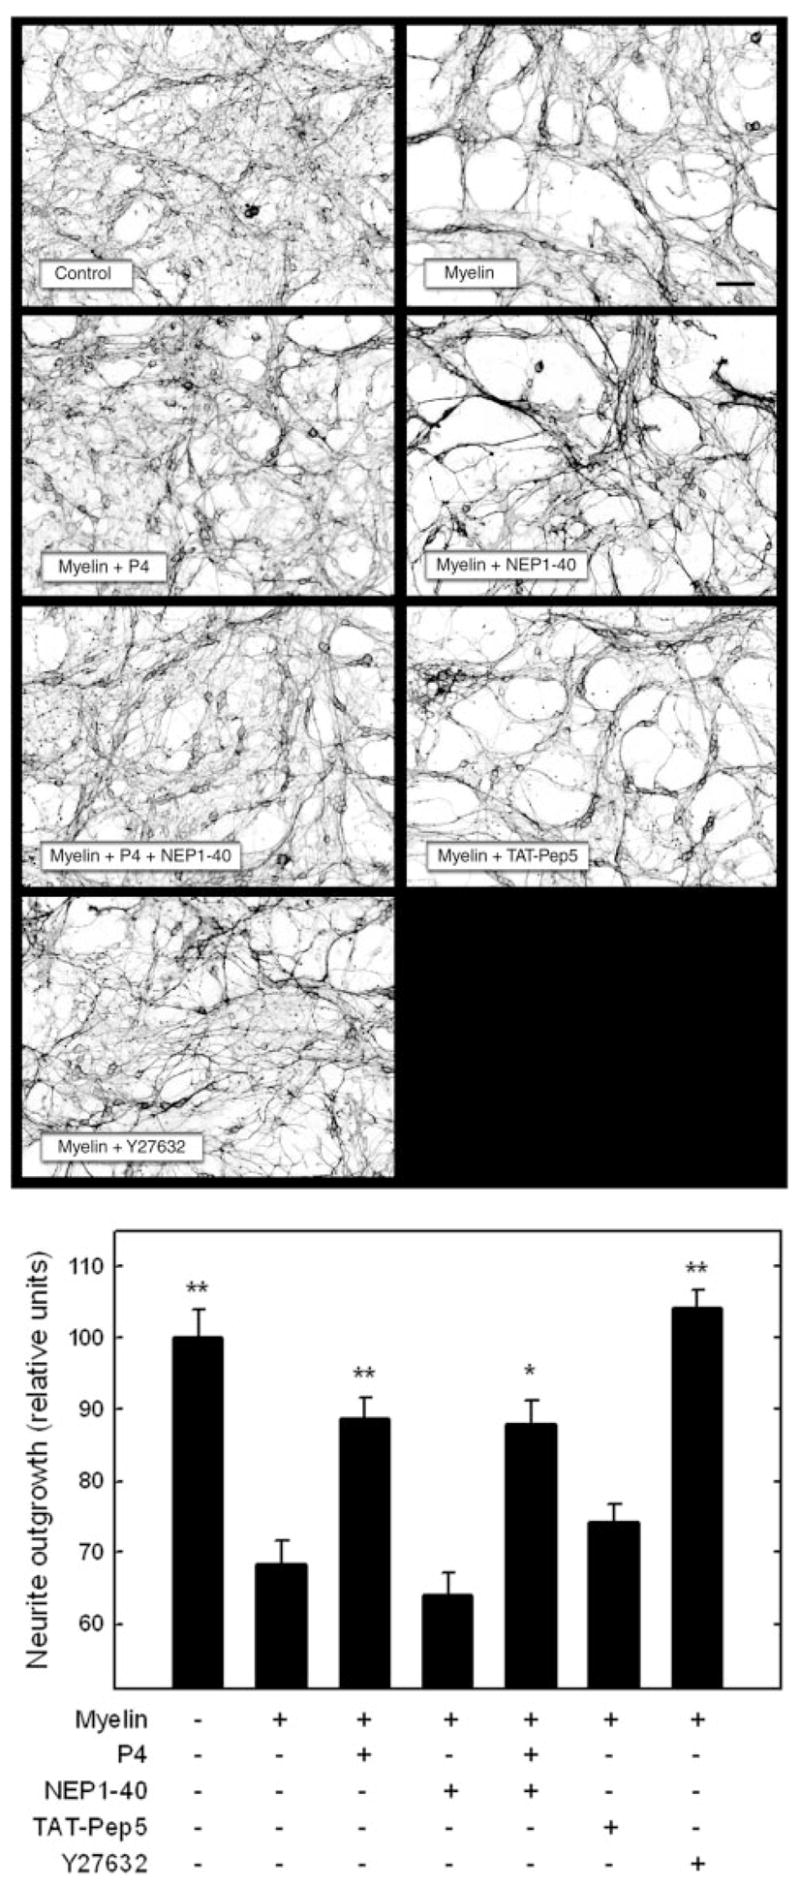
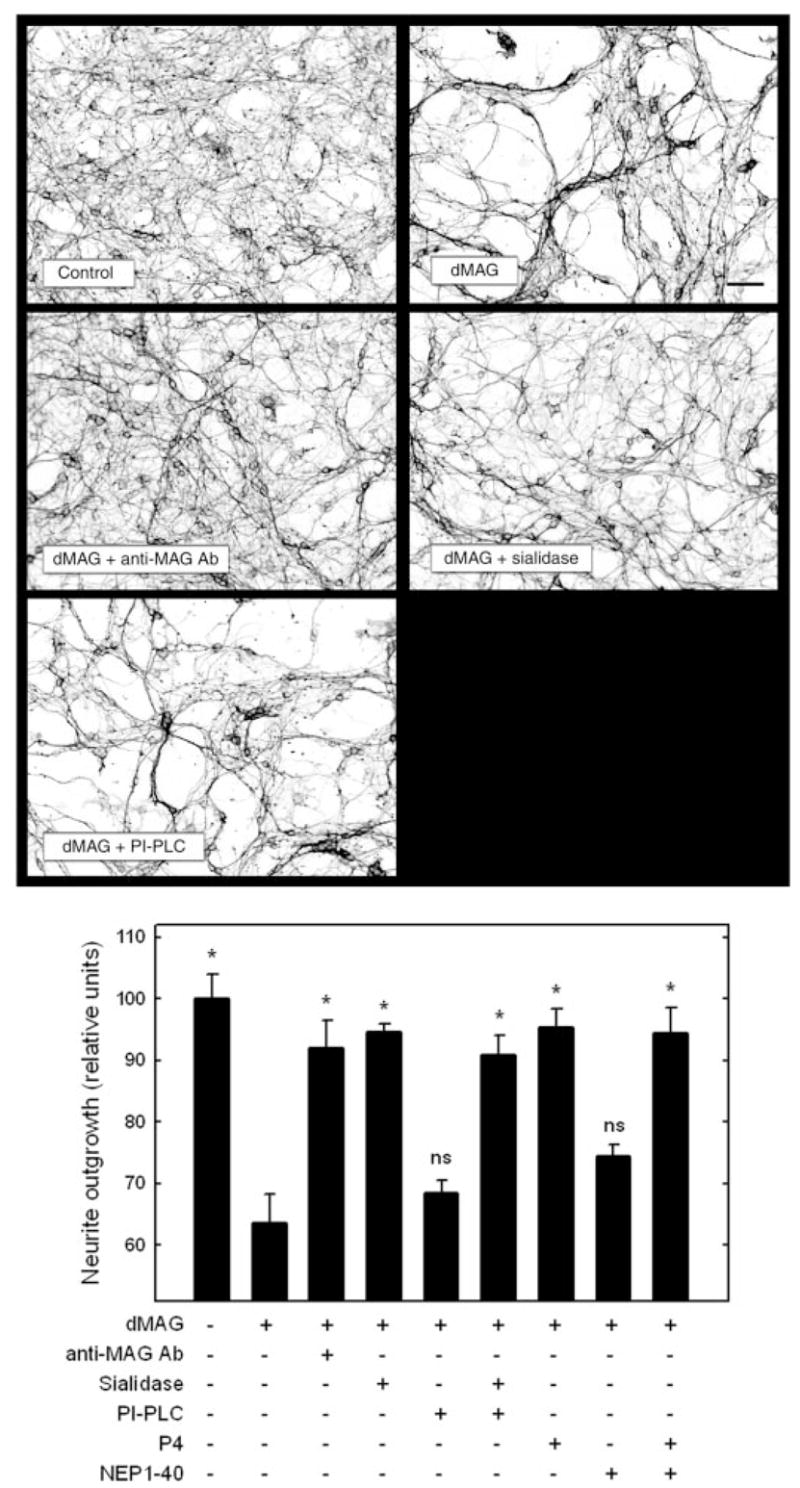
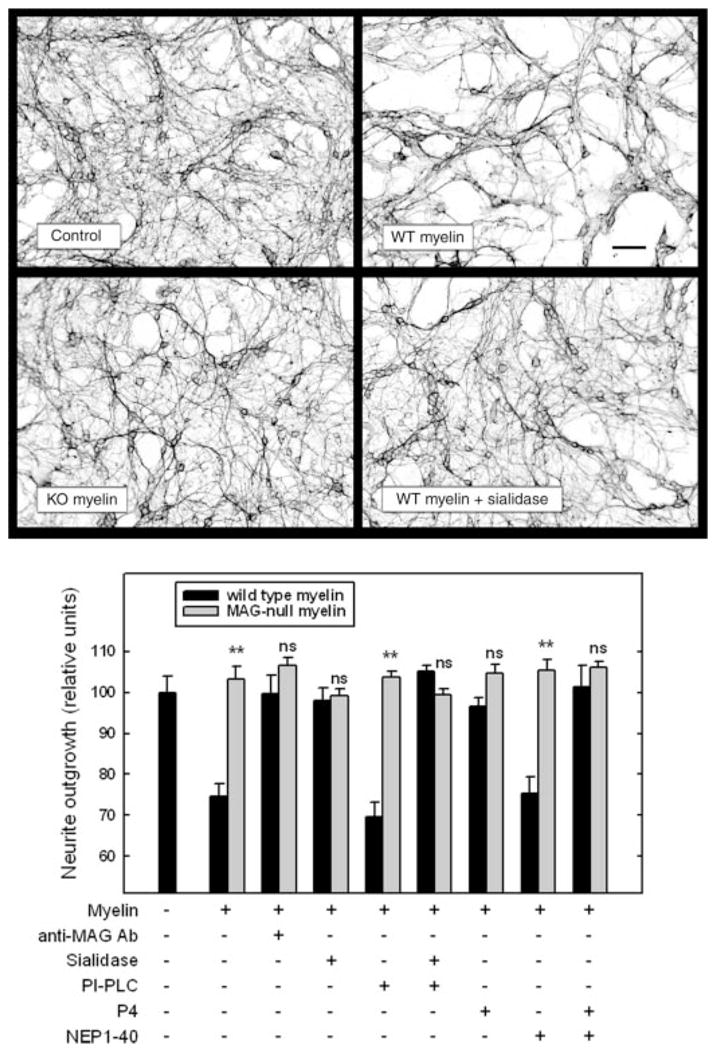
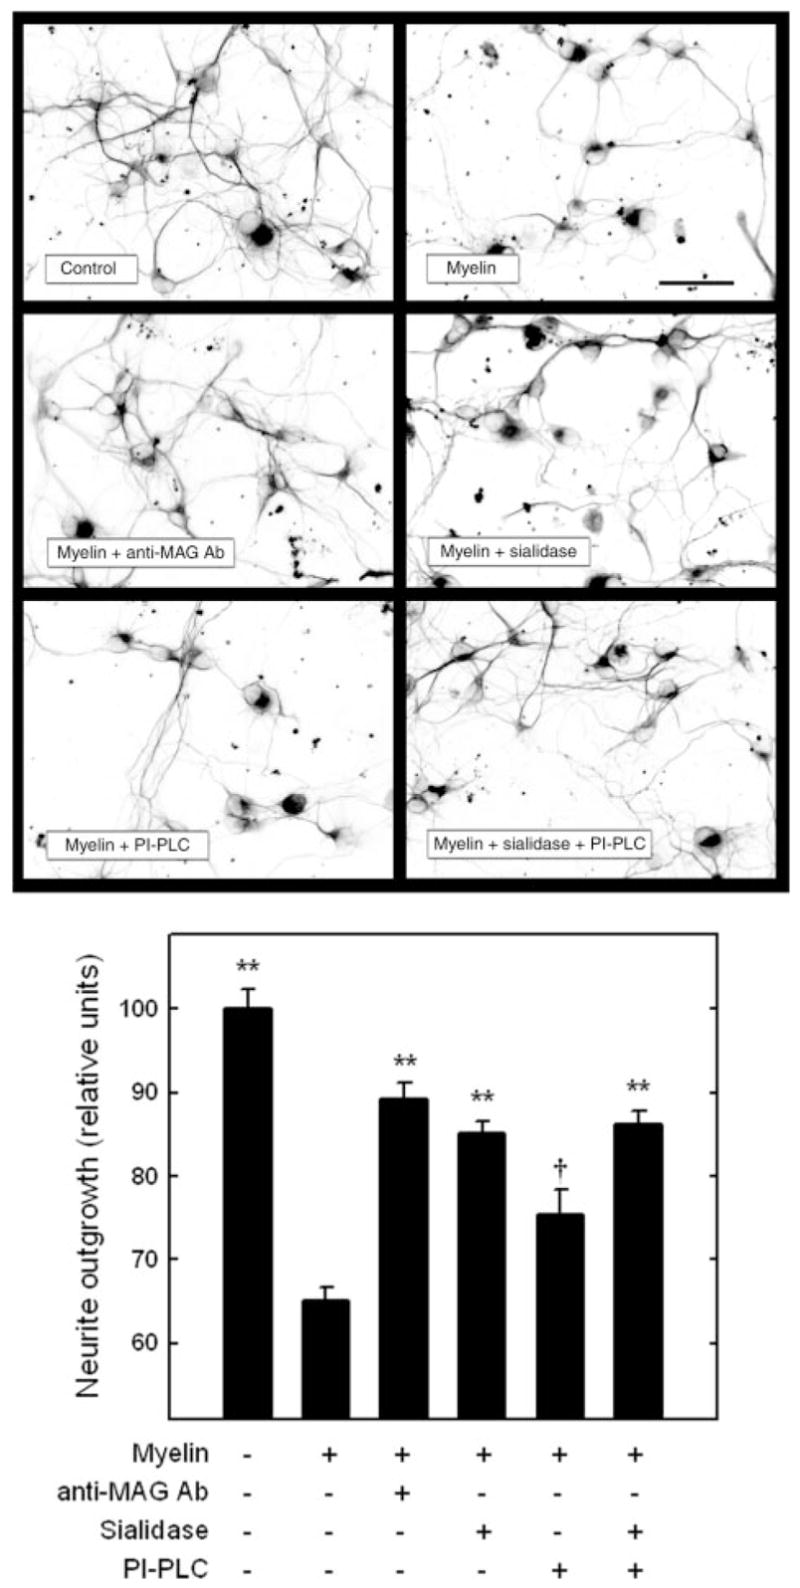
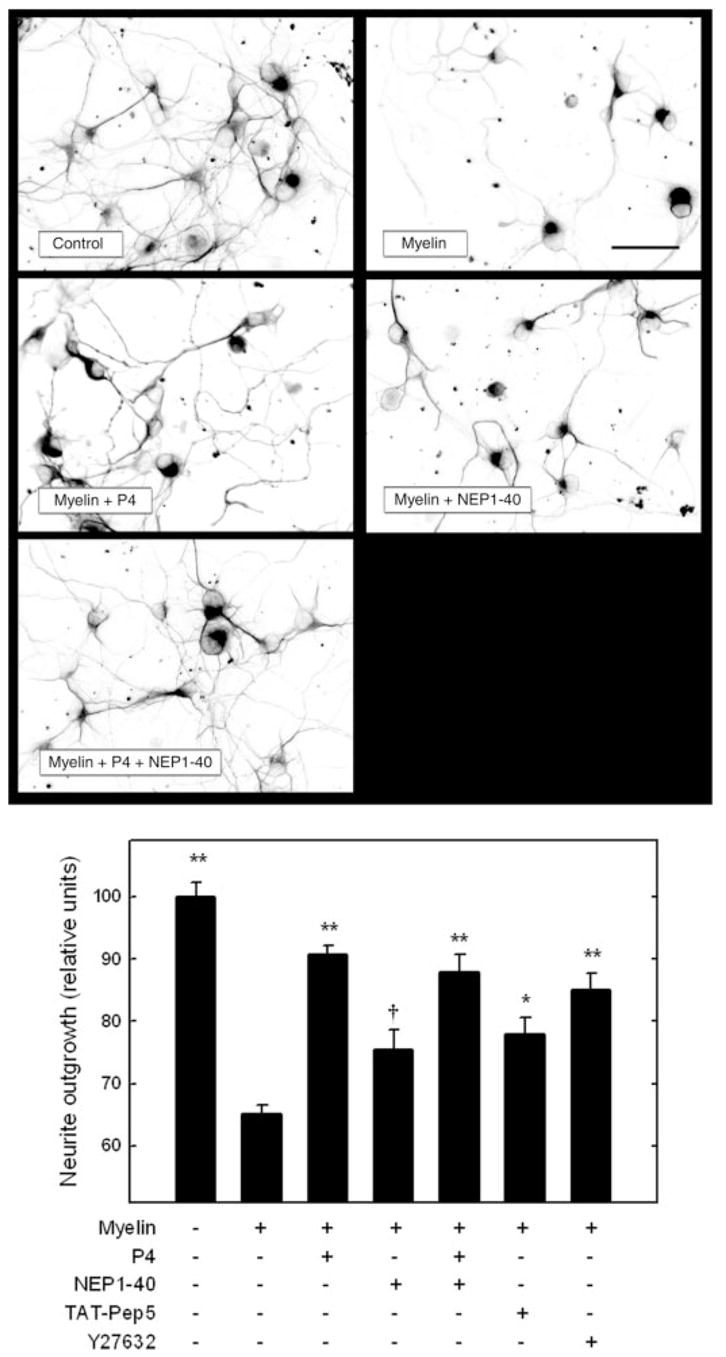
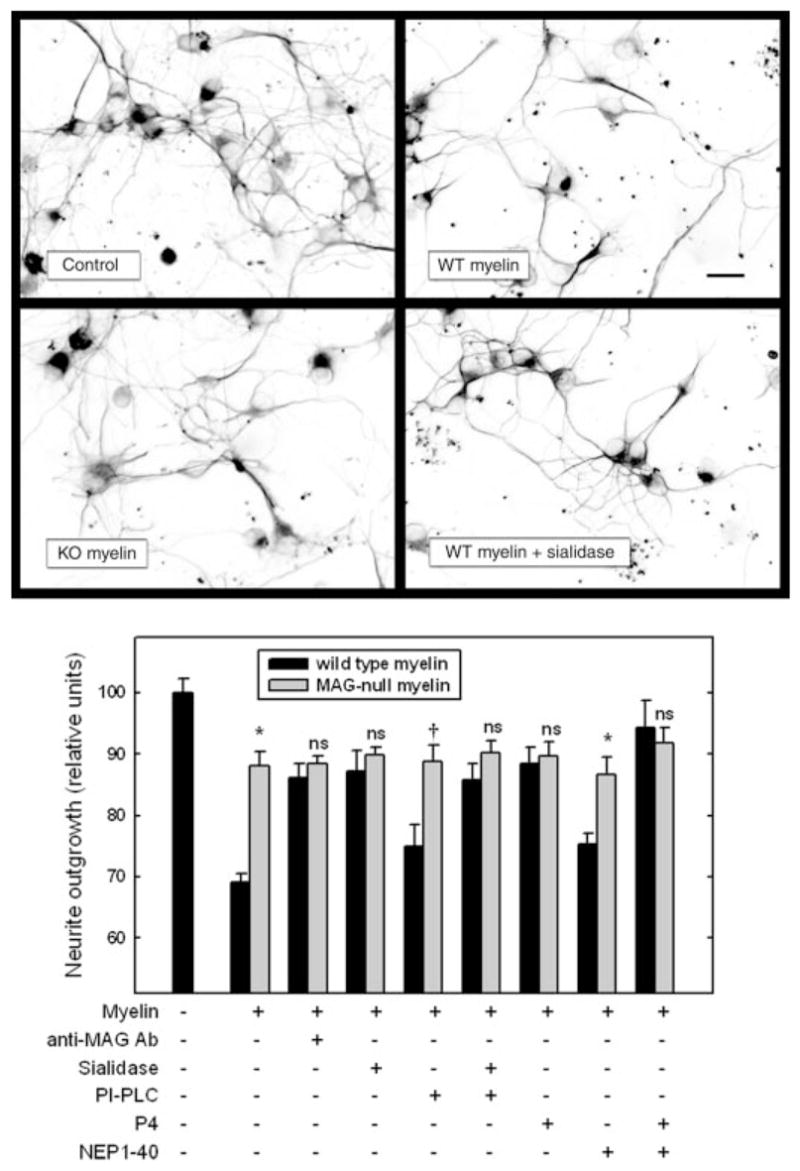
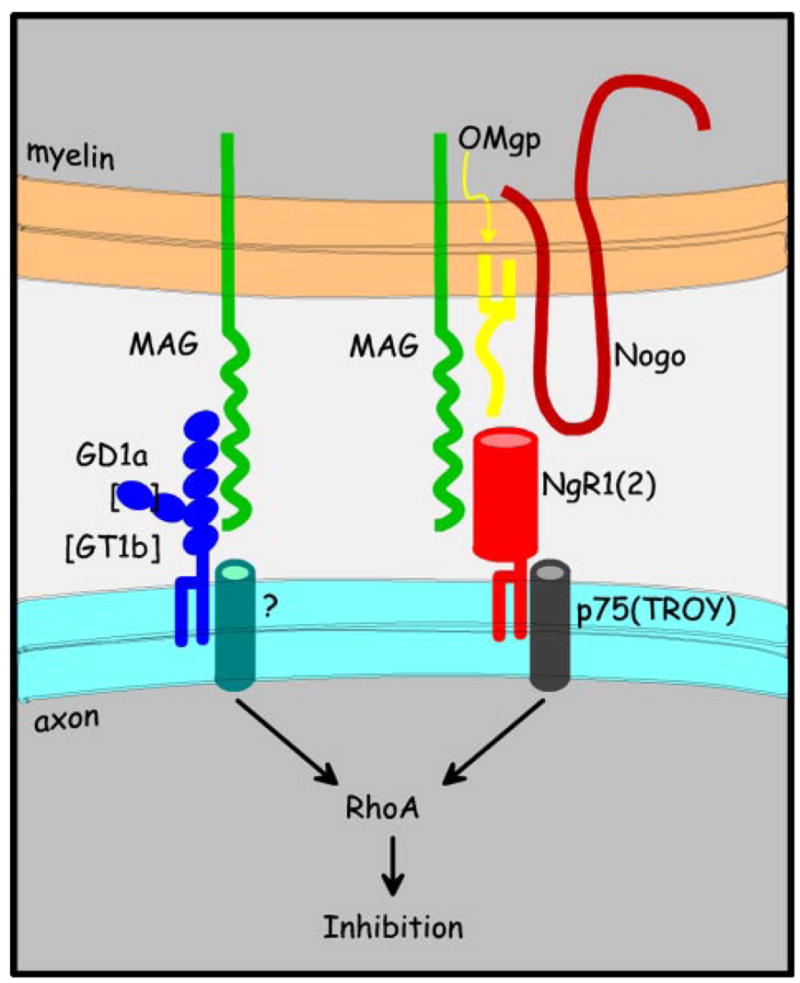
In the injured nervous system, myelin-associated glycoprotein (MAG) on residual myelin binds to receptors on axons, inhibits axon outgrowth, and limits functional recovery. Conflicting reports identify gangliosides (GD1a and GT1b) and glycosylphosphatidylinositol-anchored Nogo receptors (NgRs) as exclusive axonal receptors for MAG. We used enzymes and pharmacological agents to distinguish the relative roles of gangliosides and NgRs in MAG-mediated inhibition of neurite outgrowth from three nerve cell types, dorsal root ganglion neurons (DRGNs), cerebellar granule neurons (CGNs), and hippocampal neurons. Primary rat neurons were cultured on control substrata and substrata adsorbed with full-length native MAG extracted from purified myelin. The receptors responsible for MAG inhibition of neurite outgrowth varied with nerve cell type. In DRGNs, most of the MAG inhibition was via NgRs, evidenced by reversal of inhibition by phosphatidylinositol-specific phospholipase C (PI-PLC), which cleaves glycosylphosphatidylinositol anchors, or by NEP1-40, a peptide inhibitor of NgR. A smaller percentage of MAG inhibition of DRGN outgrowth was via gangliosides, evidenced by partial reversal by addition of sialidase to cleave GD1a and GT1b or by P4, an inhibitor of ganglioside biosynthesis. Combining either PI-PLC and sialidase or NEP1-40 and P4 was additive. In contrast to DRGNs, in CGNs MAG inhibition was exclusively via gangliosides, whereas inhibition of hippocampal neuron outgrowth was mostly reversed by sialidase or P4 and only modestly reversed by PI-PLC or NEP1-40 in a non-additive fashion. A soluble proteolytic fragment of native MAG, dMAG, also inhibited neurite outgrowth. In DRGNs, dMAG inhibition was exclusively NgR-dependent, whereas in CGNs it was exclusively ganglioside-dependent. An inhibitor of Rho kinase reversed MAG-mediated inhibition in all nerve cells, whereas a peptide inhibitor of the transducer p75(NTR) had cell-specific effects quantitatively similar to NgR blockers. Our data indicate that MAG inhibits axon outgrowth via two independent receptors, gangliosides and NgRs.


Figures

FIGURE 1
FIGURE 1. MAG inhibition of neurite outgrowth from DRGNs is via both GPI-anchored proteins and sialoglycans
DRGNs were plated on control surfaces or the same surfaces adsorbed with detergent-extracted myelin proteins (Myelin). As indicated, 1 h after plating, cultures were treated with 10 μg/ml anti-MAG mAb, 8 milliunits/ml sialidase, or 1 unit/ml PI-PLC. After 24 h, the cultures were fixed and stained with anti-tubulin mAb. Representative fluorescence micrographs are presented as reverse gray scale images to enhance clarity (bar, 50 μm). Neurite outgrowth (mean ± S.E.) was quantified using image analysis and normalized with respect to the control. Symbols indicate statistical comparison with myelin-inhibited neurite outgrowth: *, p < 0.01; **, p < 0.001. Ab, antibody.
FIGURE 2
FIGURE 2. MAG inhibition of neurite outgrowth from DRGNs is via both NgR and glycosphingolipids
DRGNs were plated on control surfaces or the same surfaces adsorbed with detergent-extracted myelin proteins (Myelin). As indicated, 1 h after plating, cultures were treated with 1 μM P4, 1 μM NEP1–40, 200 nM TAT-Pep5, or 10 μM Y-27632. After 24 h, the cultures were fixed and stained with anti-tubulin mAb. Representative fluorescence micrographs are presented as reverse gray scale images to enhance clarity (bar, 50 μm). Neurite outgrowth (mean ± S.E.) was quantified using image analysis and normalized with respect to the control. Symbols indicate statistical comparison with myelin-inhibited neurite outgrowth: *, p < 0.01; **, p < 0.001.
FIGURE 3
FIGURE 3. Inhibition of neurite outgrowth from DRGNs by dMAG is predominantly via NgR
DRGNs were plated on control surfaces. dMAG was added to the indicated cultures 1 h after plating. As indicated, cultures were treated at the same time with 10 μg/ml anti-MAG mAb, 8 milliunits/ml sialidase, 1 unit/ml PI-PLC, 1 μM P4, or 1 μM NEP1– 40. After 24 h, the cultures were fixed and stained with anti-tubulin mAb. Representative fluorescence micrographs are presented as reverse gray scale images to enhance clarity (bar, 50 μm). Neurite outgrowth (mean ± S.E.) was quantified using image analysis and normalized with respect to the control. Symbols indicate statistical comparison with myelin-inhibited neurite outgrowth: *, p < 0.01; ns, not statistically significant. Ab, antibody.
FIGURE 4
FIGURE 4. Neurite outgrowth from DRGNs on substrata adsorbed with extracts of wild type and MAG-null mouse myelin demonstrates that MAG-mediated inhibition is via NgR and gangliosides
Rat DRGNs were plated on control surfaces or the same surfaces adsorbed with detergent-extracted myelin proteins from wild type mouse brain (WT) or MAG-null mouse brain (KO). As indicated, cultures were treated 1 h after plating with 10 μg/ml anti-MAG mAb, 8 milliunits/ml sialidase, 1 unit/ml PI-PLC, 1 μM P4, or 1 μM NEP1– 40. After 24 h, the cultures were fixed and stained with anti-tubulin mAb. Representative fluorescence micrographs are presented as reverse gray scale images to enhance clarity (bar, 50 μm). Neurite outgrowth (mean ± S.E.) was quantified using image analysis and normalized with respect to the control. Symbols indicate statistical comparison of identically treated wild type and MAG-null cultures: *, p < 0.02; **, p < 0.001; ns, not statistically significant. All treatments significantly reversed the inhibition due to wild type mouse myelin extract (p < 0.01). Ab, antibody.
FIGURE 5
FIGURE 5. MAG inhibition of axon outgrowth from CGNs is via sialoglycans
CGNs were plated on control surfaces or the same surfaces adsorbed with detergent-extracted myelin proteins (Myelin). As indicated, 1 h after plating, cultures were treated with 10 μg/ml anti-MAG mAb, 8 milliunits/ml sialidase, or 1 unit/ml PI-PLC. After 48 h, the cultures were fixed and stained with anti-GAP43 antibody. Representative fluorescence micrographs are presented as reverse gray scale images to enhance clarity (bar, 50 μm). Axon outgrowth (mean ± S.E.) was quantified using image analysis and normalized with respect to the control. Symbols indicate statistical comparison with myelin-inhibited axon outgrowth: *, p < 0.01; **, p < 0.001. Ab, antibody.
FIGURE 6
FIGURE 6. MAG inhibition of axon outgrowth from CGNs is via glycosphingolipids
CGNs were plated on control surfaces or the same surfaces adsorbed with detergent-extracted myelin proteins (Myelin). As indicated, 1 h after plating, cultures were treated with 1 μM P4, 1 μM NEP1– 40, 100 nM TAT-Pep5, or 5 μM Y-27632. After 48 h, the cultures were fixed and stained with anti-GAP43 antibody. Representative fluorescence micrographs are presented as reverse gray scale images to enhance clarity (bar, 50 μm). Axon outgrowth (mean ± S.E.) was quantified using image analysis and normalized with respect to the control. Symbols indicate statistical comparison with myelin-inhibited axon outgrowth: *, p < 0.01; **, p < 0.001.
FIGURE 7
FIGURE 7. Inhibition of axon outgrowth from CGNs by dMAG is via gangliosides
CGNs were plated on control surfaces. dMAG was added to the indicated cultures 1 h after plating. As indicated, cultures were treated at the same time with 10 μg/ml anti-MAG antibody, 8 milliunits/ml sialidase, 1 unit/ml PI-PLC, 1 μM P4, or 1 μM NEP1– 40. After 48 h, the cultures were fixed and stained with anti-GAP43 antibody. Representative fluorescence micrographs are presented as reverse gray scale images to enhance clarity (bar, 50 μm). Axon outgrowth (mean ± S.E.) was quantified using image analysis and normalized with respect to the control. Symbols indicate statistical comparison with myelin-inhibited axon outgrowth: *, p < 0.005; ns, not statistically significant. Ab, antibody.
FIGURE 8
FIGURE 8. Axon outgrowth from CGNs on substrata adsorbed with extracts of wild type and MAG-null mouse myelin demonstrates that MAG-mediated inhibition is via gangliosides
Rat CGNs were plated on control surfaces or the same surfaces adsorbed with detergent-extracted myelin proteins from wild type mouse brain (WT) or MAG-null mouse brain (KO). As indicated, cultures were treated 1 h after plating with 10 μg/ml anti-MAG antibody, 8 milliunits/ml sialidase, 1 unit/ml PI-PLC, 1 μM P4, or 1 μM NEP1– 40. After 48 h, the cultures were fixed and stained with anti-GAP43 antibody, and axon outgrowth was quantified as described in the text. Representative fluorescence micrographs are presented as reverse gray scale images to enhance clarity (bar, 50 μm). Axon outgrowth (mean ± S.E.) was quantified using image analysis and normalized with respect to the control. Symbols indicate statistical comparison of identically treated wild type and MAG-null cultures: **, p < 0.001; ns, not statistically significant.
FIGURE 9
FIGURE 9. MAG inhibition of neurite outgrowth from HNs is primarily via sialoglycans
HNs were plated on control surfaces or the same surfaces adsorbed with detergent-extracted myelin proteins (Myelin). As indicated, 1 h after plating, cultures were treated with 10 μg/ml anti-MAG mAb, 8 milliunits/ml sialidase, or 250 milliunits/ml PI-PLC. After 48 h, the cultures were fixed and stained with anti-tubulin mAb. Representative fluorescence micrographs are presented as reverse gray scale images to enhance clarity (bar, 100 μm). Neurite outgrowth (mean ± S.E.) was quantified using image analysis and normalized with respect to the control. Symbols indicate statistical comparison with myelin-inhibited neurite outgrowth: †, p < 0.02; **, p < 0.001. Ab, antibody.
FIGURE 10
FIGURE 10. MAG inhibition of neurite outgrowth from HNs is primarily via glycosphingolipids
HNs were plated on control surfaces or the same surfaces adsorbed with detergent-extracted myelin proteins (Myelin). As indicated, 1 h after plating, cultures were treated with 1 μM P4, 1 μM NEP1– 40, 100 nM TAT-Pep5, or 5 μM Y-27632. After 48 h, the cultures were fixed and stained with anti-tubulin mAb. Representative fluorescence micrographs are presented as reverse gray scale images to enhance clarity (bar, 100 μm). Neurite outgrowth (mean ± S.E.) was quantified using image analysis and normalized with respect to the control. Symbols indicate statistical comparison with myelin-inhibited neurite outgrowth: †, p < 0.02; *, p < 0.01; **, p < 0.001.
FIGURE 11
FIGURE 11. Neurite outgrowth from HNs on substrata adsorbed with extracts of wild type and MAG-null mouse myelin demonstrates that MAG-mediated inhibition is primarily via gangliosides
Rat HNs were plated on control surfaces or the same surfaces adsorbed with detergent-extracted myelin proteins from wild type mouse brain (WT) or MAG-null mouse brain (KO). As indicated, cultures were treated 1 h after plating with 10 μg/ml anti-MAG mAb, 8 milliunits/ml sialidase, 250 milliunits/ml PI-PLC, 1 μM P4, or 1 μM NEP1– 40. After 48 h, the cultures were fixed and stained with anti-tubulin mAb. Representative fluorescence micrographs are presented as reverse gray scale images to enhance clarity (bar, 100 μm). Neurite outgrowth (mean ± S.E.) was quantified using image analysis and normalized with respect to the control. Symbols indicate statistical comparison of identically treated wild type and MAG-null cultures: †, p < 0.05; *, p < 0.01; ns, not statistically significant.
FIGURE 12
FIGURE 12. Dual receptor model of MAG-mediated inhibition of axon regeneration
MAG is proposed to bind independently to gangliosides GD1a/GT1b and Nogo receptors NgR1/NgR2. Nogo receptors may associate with p75NTR (or structurally related TROY) to transduce binding, through multiple steps, to RhoA activation, whereas the molecules that transduce MAG-ganglioside binding have yet to be fully determined. Cross-talk between pathways or combinations of the two pathways (e.g. ganglioside association with p75NTR in some cells (35)) are not excluded but are left off the model for clarity.

Similar articles

Cited by

References

    1. Sandvig A, Berry M, Barrett LB, Butt A, Logan A. Glia. 2004;46:225–251. - PubMed
    1. Yiu G, He Z. Nat Rev Neurosci. 2006;7:617–627. - PMC - PubMed
    1. David S, Lacroix S. Annu Rev Neurosci. 2003;26:411–440. - PubMed
    1. Spencer T, Domeniconi M, Cao Z, Filbin MT. Curr Opin Neurobiol. 2003;13:133–139. - PubMed
    1. Quarles RH. J Neurochem. 2007;100:1431–1448. - PubMed

Publication types

MeSH terms