. 2007 Jul 24;104(30):12410-5.
doi: 10.1073/pnas.0705140104. Epub 2007 Jul 17.

Widely distributed noncoding purifying selection in the human genome

Affiliations

Widely distributed noncoding purifying selection in the human genome

Saurabh Asthana et al. Proc Natl Acad Sci U S A. .

Abstract

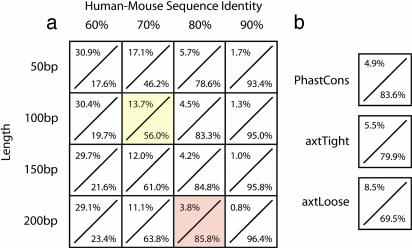
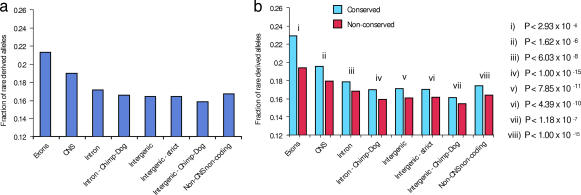
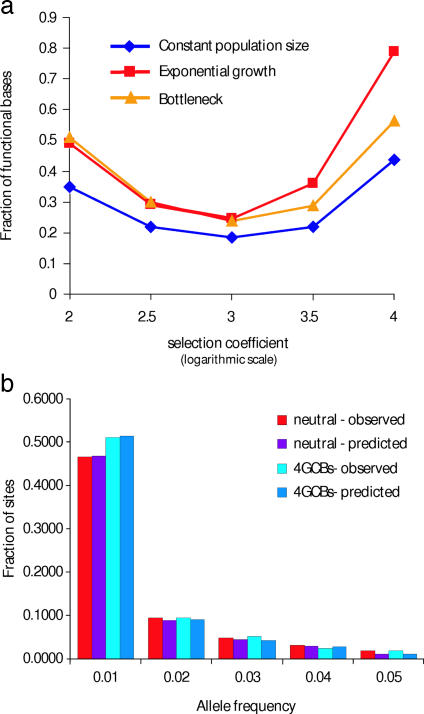
It is widely assumed that human noncoding sequences comprise a substantial reservoir for functional variants impacting gene regulation and other chromosomal processes. Evolutionarily conserved noncoding sequences (CNSs) in the human genome have attracted considerable attention for their potential to simplify the search for functional elements and phenotypically important human alleles. A major outstanding question is whether functionally significant human noncoding variation is concentrated in CNSs or distributed more broadly across the genome. Here, we combine whole genome sequence data from four nonhuman species (chimp, dog, mouse, and rat) with recently available comprehensive human polymorphism data to analyze selection at single-nucleotide resolution. We show that a substantial fraction of active purifying selection in human noncoding sequences occurs outside of CNSs and is diffusely distributed across the genome. This finding suggests the existence of a large complement of human noncoding variants that may impact gene expression and phenotypic traits, the majority of which will escape detection with current approaches to genome analysis.


Conflict of interest statement

The authors declare no conflict of interest.

Figures

Fig. 1.
Fig. 1.
Selection at conserved vs. nonconserved nucleotide positions (EGP). Effect of partitioning genomic sequence features into conserved and nonconserved positions on nucleotide diversity and allele frequency distributions. Only EGP SNPs at non-CpG sites were considered. (a) Nucleotide diversity (π; vertical axis) in exons, CNSs defined by PhastCons, introns, introns aligning between chimp and dog but not between chimp and rodents, intergenic sequences, intergenic sequences aligning between chimp and dog but not between chimp and rodents, and all non-CNS noncoding sequences. (b) Nucleotide diversity at conserved (green) and nonconserved (orange) positions within genomic features shown in a. P values (Fisher exact test) for differences in density of segregating sites between conserved and nonconserved positions at corresponding features are shown. (c) Fraction of SNPs with derived allele <1% (vertical axis) within different genomic sequence features. (d) Fraction of SNPs with derived allele <1% at conserved (blue) and nonconserved (red) positions within features shown in c, with corresponding P values. Semitransparent data indicate features for which the number of SNPs within the EGP data set do not provide sufficient power to detect statistically significant differences in allele frequency distribution.
Fig. 2.
Fig. 2.
Distribution of 4GCBs relative to CNSs. CNSs are typically defined by lengths of human genomic sequence in which the percent human–mouse sequence identity exceeds a threshold value. Shown, for each combination of length (50–200 bp) and percentage of human–mouse sequence identity (60%–90%) (a) or various other CNS definitions (b), is the fraction of the human genome encompassed by that CNS definition (range 30.8% to 0.8%) over the fraction of 4GCBs that fall outside of this definition (range 17.6% to 96.4%). For comparison, parameters used in previous studies of CNSs are highlighted in yellow (34) and red (17). The PhastCons CNS definition is the one used to generate Figs. 1 and 3.
Fig. 3.
Fig. 3.
Selection at conserved vs. nonconserved nucleotide positions (HapMap). Effect of partitioning genomic sequence features into conserved and nonconserved positions on HapMap allele frequency distributions (non-CpG sites). (a) Fraction of rare derived alleles (frequency <5%; HapMap Yoruba data set) in genomic sequence features (see legend to Fig. 1 for details). (b) Fraction of SNPs with derived allele <5% at conserved (blue) and nonconserved (red) positions within features shown in a, with corresponding P values.
Fig. 4.
Fig. 4.
Fraction of functionally significant nucleotide positions among 4GCBs. (a) Fraction of functional sites under selection (y axis) sufficient to explain the observed excess of rare alleles in conserved positions, expressed as a function of selection coefficient (x axis; logarithmic scale) for three different population histories. The fraction of functional sites exhibits a minimal value (under any possible strength of selection) needed to explain the observed shift in allele frequency distribution. This minimum provides a lower limit estimate of the fraction of functional sites. (b) Allele frequency distributions for SNPs in non-4GCB (red) and 4GCB intronic positions (light blue) are shown in parallel with theoretical distributions (corresponding to the optima from a) for neutral SNPs (purple) and a mixture of neutral SNPs and functional SNPs (dark blue).

Similar articles

Cited by

References

    1. Venter JC, Adams MD, Myers EW, Li PW, Mural RJ, Sutton GG, Smith HO, Yandell M, Evans CA, Holt RA, et al. Science. 2001;291:1304–1351. - PubMed
    1. Miller W, Makova KD, Nekrutenko A, Hardison RC. Annu Rev Genomics Hum Genet. 2004;5:15–56. - PubMed
    1. Boffelli D, Nobrega MA, Rubin EM. Nat Rev Genet. 2004;5:456–465. - PubMed
    1. Dermitzakis ET, Reymond A, Antonarakis SE. Nat Rev Genet. 2005;6:151–157. - PubMed
    1. Waterston RH, Lindblad-Toh K, Birney E, Rogers J, Abril JF, Agarwal P, Agarwala R, Ainscough R, Alexandersson M, An P, et al. Nature. 2002;420:520–562. - PubMed

LinkOut - more resources