

Fiber-dependent amyloid formation as catalysis of an existing reaction pathway
- PMID: 17640888
- PMCID: PMC1941471
- DOI: 10.1073/pnas.0703306104
Fiber-dependent amyloid formation as catalysis of an existing reaction pathway
Abstract
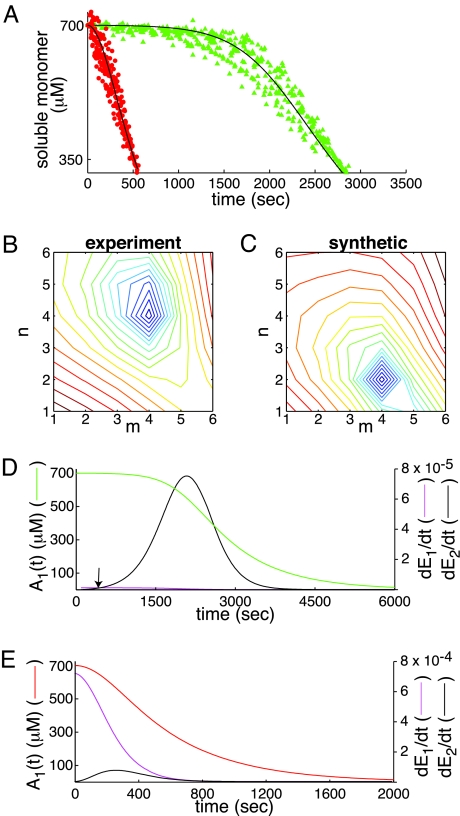
A central component of a number of degenerative diseases is the deposition of protein as amyloid fibers. Self-assembly of amyloid occurs by a nucleation-dependent mechanism that gives rise to a characteristic sigmoidal reaction profile. The abruptness of this transition is a variable characteristic of different proteins with implications to both chemical mechanism and the aggressiveness of disease. Because nucleation is defined as the rate-limiting step, we have sought to determine the nature of this step for a model system derived from islet amyloid polypeptide. We show that nucleation occurs by two pathways: a fiber-independent (primary) pathway and a fiber-dependent (secondary) pathway. We first show that the balance between primary and secondary contributions can be manipulated by an external interface. Specifically, in the presence of this interface, the primary mechanism dominates, whereas in its absence, the secondary mechanism dominates. Intriguingly, we determine that both the reaction order and the enthalpy of activation of the two nucleation processes are identical. We interrogate this coincidence by global analysis using a simplified model generally applicable to protein polymerization. A physically reasonable set of parameters can be found to satisfy the coincidence. We conclude that primary and secondary nucleation need not represent different processes for amyloid formation. Rather, they are alternative manifestations of the same, surface-catalyzed nucleation event.
Conflict of interest statement
The authors declare no conflict of interest.
Figures


Similar articles
-
Islet amyloid: phase partitioning and secondary nucleation are central to the mechanism of fibrillogenesis.Biochemistry. 2002 Apr 9;41(14):4694-703. doi: 10.1021/bi0160462. Biochemistry. 2002. PMID: 11926832
-
The role of prefibrillar structures in the assembly of a peptide amyloid.J Mol Biol. 2009 Oct 16;393(1):214-26. doi: 10.1016/j.jmb.2009.06.026. Epub 2009 Jun 12. J Mol Biol. 2009. PMID: 19524594
-
Identification of a novel human islet amyloid polypeptide beta-sheet domain and factors influencing fibrillogenesis.J Mol Biol. 2001 May 4;308(3):515-25. doi: 10.1006/jmbi.2001.4593. J Mol Biol. 2001. PMID: 11327784
-
Secondary nucleation in amyloid formation.Chem Commun (Camb). 2018 Aug 2;54(63):8667-8684. doi: 10.1039/c8cc02204f. Chem Commun (Camb). 2018. PMID: 29978862 Review.
-
Understanding amyloid fibril nucleation and aβ oligomer/drug interactions from computer simulations.Acc Chem Res. 2014 Feb 18;47(2):603-11. doi: 10.1021/ar4002075. Epub 2013 Dec 24. Acc Chem Res. 2014. PMID: 24368046 Review.
Cited by
-
Thermodynamic and kinetic design principles for amyloid-aggregation inhibitors.Proc Natl Acad Sci U S A. 2020 Sep 29;117(39):24251-24257. doi: 10.1073/pnas.2006684117. Epub 2020 Sep 14. Proc Natl Acad Sci U S A. 2020. PMID: 32929030 Free PMC article.
-
Assembly Mechanism for Aggregation of Amyloid Fibrils.Int J Mol Sci. 2018 Jul 23;19(7):2141. doi: 10.3390/ijms19072141. Int J Mol Sci. 2018. PMID: 30041455 Free PMC article.
-
Negative membrane curvature catalyzes nucleation of endosomal sorting complex required for transport (ESCRT)-III assembly.Proc Natl Acad Sci U S A. 2015 Dec 29;112(52):15892-7. doi: 10.1073/pnas.1518765113. Epub 2015 Dec 14. Proc Natl Acad Sci U S A. 2015. PMID: 26668364 Free PMC article.
-
Folded small molecule manipulation of islet amyloid polypeptide.Chem Biol. 2014 Jun 19;21(6):775-81. doi: 10.1016/j.chembiol.2014.05.007. Epub 2014 Jun 12. Chem Biol. 2014. PMID: 24930968 Free PMC article.
-
Differences in Protein Concentration Dependence for Nucleation and Elongation in Light Chain Amyloid Formation.Biochemistry. 2017 Feb 7;56(5):757-766. doi: 10.1021/acs.biochem.6b01043. Epub 2017 Jan 24. Biochemistry. 2017. PMID: 28074646 Free PMC article.
References
Publication types
MeSH terms
Substances
Grants and funding
LinkOut - more resources
Full Text Sources
Other Literature Sources
Molecular Biology Databases
