. 2007 Jul 24;104(30):12365-70.
doi: 10.1073/pnas.0701497104. Epub 2007 Jul 17.

Quantitative analyses reveal the importance of regulated Hdmx degradation for p53 activation

Affiliations

Quantitative analyses reveal the importance of regulated Hdmx degradation for p53 activation

Yunyuan V Wang et al. Proc Natl Acad Sci U S A. .

Abstract

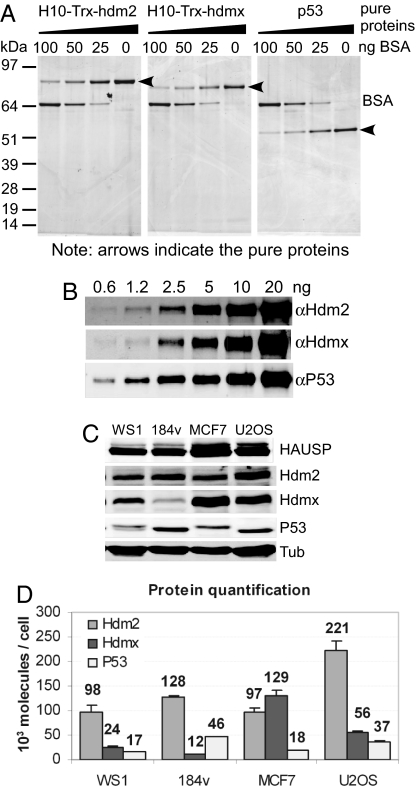
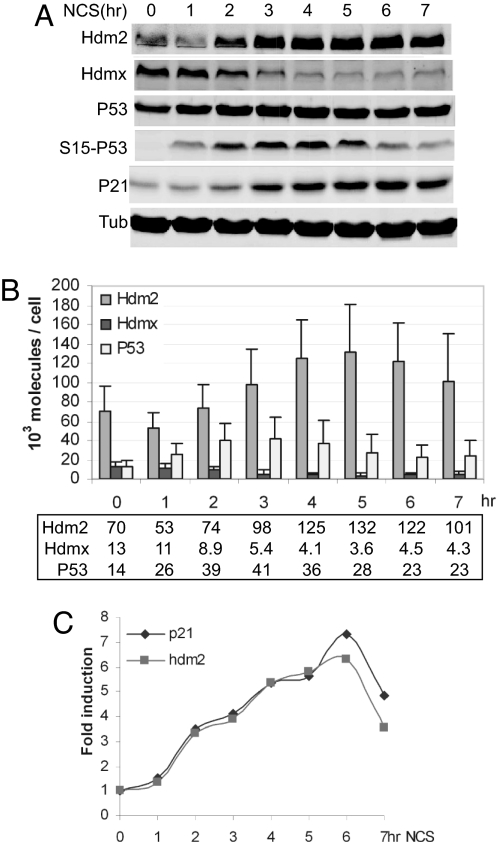
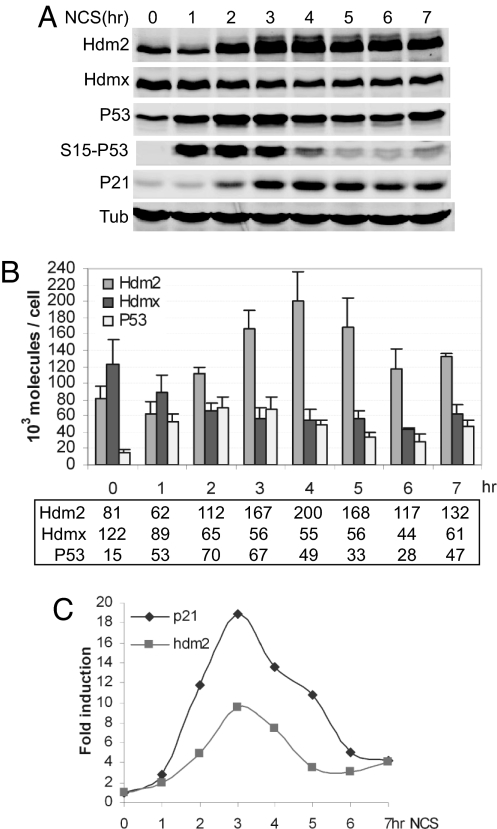
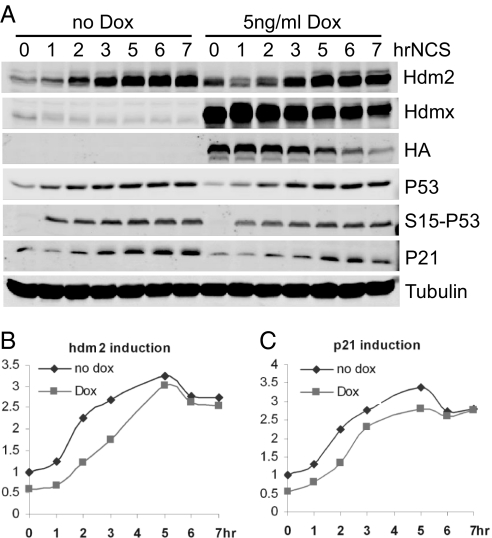
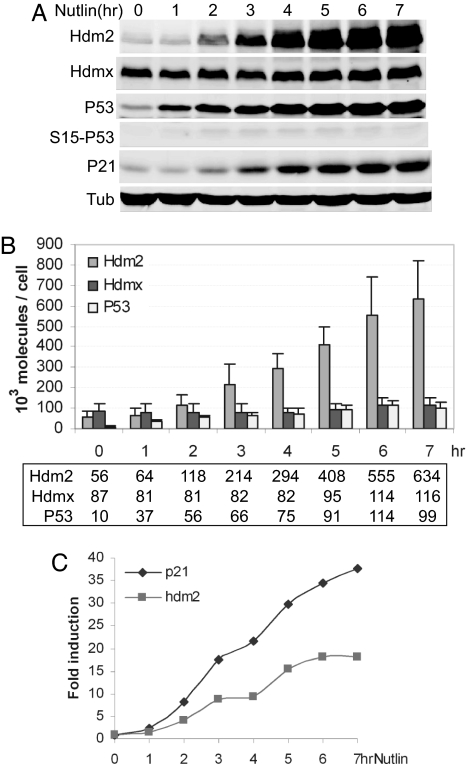
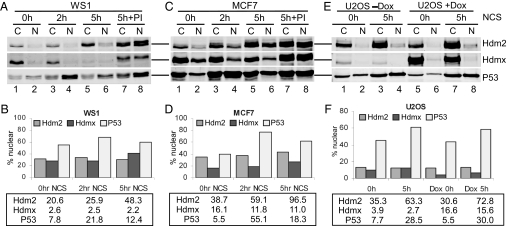
P53 regulates numerous downstream targets to induce cell cycle arrest, senescence, apoptosis, and DNA repair in response to diverse stresses. Hdm2 and Hdmx are critical negative regulators of P53 because Hdm2 regulates P53 abundance, and both can antagonize P53 transactivation. Modest changes in Hdm2 or Hdmx abundance affect P53 regulation, yet quantitative information regarding their endogenous intracellular concentrations and subcellular distributions during a stress response are lacking. We analyzed these parameters in normal and cancer cells after DNA damage. Our data show that the nuclear abundance of Hdm2 and Hdmx relative to P53 limits P53 activity in cells growing in culture. Upon DNA damage, P53 nuclear abundance increases, whereas Hdm2 and Hdmx stability decreases, which greatly limits their ability to antagonize P53, regardless of their levels. These data indicate that the damage-activated switch in Hdm2 ubiquitin ligase preference from P53 to itself and Hdmx is central to P53 activation.


Conflict of interest statement

The authors declare no conflict of interest.

Figures

Fig. 1.
Fig. 1.
Protein quantification using LiCor and Western blotting. (A) Serially diluted pure recombinant proteins were applied to each lane of a gradient polyacrylamide gel along with different known concentrations of BSA as a standard. The gel was stained with SYPRO-ruby, and the intensities of protein staining were measured by using the Typhoon image system. (B) The linearity of the system was determined by Western blotting of serially diluted known concentrations of pure recombinant P53, Hdm2, and Hdmx. Signals were analyzed by using the LiCor system. (C) Protein analyses in equal numbers of WS1, 184V, MCF7, and U2OS cells. Lysates obtained from the same numbers of cells were run on an 8% acrylamide gel along with a mix of serially diluted protein standards (data not shown) and immunoblotted with antibodies against HAUSP, Hdm2, Hdmx, P53, and α-tubulin. (D) Protein quantification based on the band intensities from the Western blot in C. All values were derived by using the LiCor system. The amounts of each protein were calculated by using band intensities from a known concentration of the respective pure proteins as standards and with known cell numbers from lysate preparation. Error bars represent SD of three experiments. Numbers represent the protein molecules × 103 per cell.
Fig. 2.
Fig. 2.
Quantitative kinetic analysis of P53 response to DNA damage in WS1 cells. (A) Time course of Western blot analysis. WS1 cells were treated with 300 ng/ml NCS for the indicated times. Cells were counted before harvesting. Lysates were analyzed by Western blotting using antibodies to detect Hdm2, Hdmx, P53, P53-phosphorylated S15 (S15-P53), P21, and α-tubulin (Tub). (B) Time course of NCS response in WS1. The amounts of Hdm2, Hdmx, and P53 per cell at the indicated times after NCS treatment were determined as described in Fig. 1. Numbers shown in the box represent the protein molecules × 103 per cell. (C) P53 activation in WS1. Time course of P53 target gene activation is shown. WS1 cells were treated as described in A. RNA was harvested and subjected to real-time QPCR with primers that amplified hdm2 and p21 genes. Gene induction was normalized to untreated.
Fig. 3.
Fig. 3.
Quantitative kinetic analysis of P53 response to DNA damage in MCF7 cells. (A) Time course of Western blot analysis. MCF7 cells were treated, lysed, and analyzed by Western blotting as described in Fig. 2. (B) Time course of NCS response in MCF7. The amounts of Hdm2, Hdmx, and P53 per cell were determined as described in Fig. 2. Numbers shown in the box represent the protein molecules × 103 per cell. (C) P53 activation in MCF7. Time course of P53 target gene activation is shown. Induction of hdm2 and p21 genes was analyzed as described in Fig. 2.
Fig. 4.
Fig. 4.
Quantitative kinetic analysis of P53 response in cells overexpressing Hdmx. (A) Time course of Western blot analysis. U2OS cells were either left untreated or treated with 5 ng/ml doxycycline (Dox) for 24 h to induce the expression of Hdmx before NCS treatment at the indicated time, followed by Western blotting as described in Fig. 2. (B and C) Time course of P53 target gene activation. Induction of hdm2 (B) and p21 (C) genes was analyzed as described in Fig. 2.
Fig. 5.
Fig. 5.
Quantitative kinetic analysis of the P53 response to Nutlin in MCF7 cells. (A) Time course of Western blot analysis. MCF7 cells were treated with 10 μM Nutlin for the indicated times, followed by Western blotting as described in Fig. 2. (B) Time course of Nutlin response in MCF7. The amounts of Hdm2, Hdmx, and P53 per cell were determined as described in Fig. 2. Numbers shown in the box represent the protein molecules × 103 per cell. (C) P53 activation in MCF7. Time course of P53 target gene activation is shown. Induction of hdm2 and p21 genes was analyzed as described in Fig. 2.
Fig. 6.
Fig. 6.
Changes in protein subcellular distribution in response to DNA damage. (A and C) WS1 (A) or MCF7 (C) cells were either left untreated or treated with 300 ng/ml NCS for 2 and 5 h or NCS plus proteasome inhibitors for 5 h. (E) U2OS cells were either left untreated or treated with doxycycline and/or NCS as described in Fig. 4. Lysates from the nuclear fraction and the cytoplasmic fraction representing the same numbers of cells were analyzed by the Western blotting as described in Fig. 1. (B, D, and F) The charts representing the estimated protein molecules in the nuclear fraction. The y axis represents the percentage of each protein in the nuclear fraction. Numbers shown in the box represent the protein molecules × 103 per cell in the nuclear fraction.

Similar articles

Cited by

References

    1. Wahl GM, Stommel JM, Krummel KA, Wade M. In: 25 Years of p53 Research. Wiman K, Hainaut P, editors. Dordrecht, The Netherlands: Springer; 2005. pp. 73–113.
    1. Jones SN, Roe AE, Donehower LA, Bradley A. Nature. 1995;378:206–208. - PubMed
    1. Montes de Oca Luna R, Wagner DS, Lozano G. Nature. 1995;378:203–206. - PubMed
    1. Parant J, Chavez-Reyes A, Little NA, Yan W, Reinke V, Jochemsen AG, Lozano G. Nat Genet. 2001;29:92–95. - PubMed
    1. Marine J-C, Francoz S, Maetens M, Wahl G, Toledo F, Lozano G. Cell Death Differ. 2006;13:927–934. - PubMed

Publication types