

doi: 10.1073/pnas.0705087104.
Epub 2007 Jul 19.
Modafinil enhances thalamocortical activity by increasing neuronal electrotonic coupling
Affiliations
- PMID: 17640897
- PMCID: PMC1925036
- DOI: 10.1073/pnas.0705087104
Item in Clipboard
Modafinil enhances thalamocortical activity by increasing neuronal electrotonic coupling
Proc Natl Acad Sci U S A.
.
Abstract
Modafinil (Provigil, Modiodal), an antinarcoleptic and mood-enhancing drug, is shown here to sharpen thalamocortical activity and to increase electrical coupling between cortical interneurons and between nerve cells in the inferior olivary nucleus. After irreversible pharmacological block of connexin permeability (i.e., by using either 18beta-glycyrrhetinic derivatives or mefloquine), modafinil restored electrotonic coupling within 30 min. It was further established that this restoration is implemented through a Ca(2+)/calmodulin protein kinase II-dependent step.
Conflict of interest statement
The authors declare no conflict of interest.
Figures
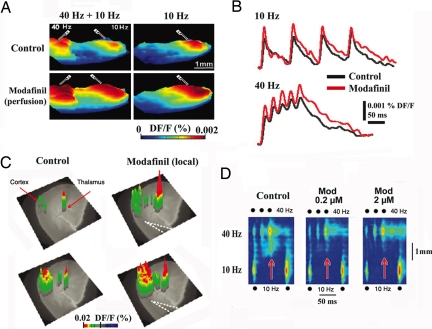
Modafinil enhances thalamocortical activity and reduces the edge effect in vitro. (A) Three-dimensional snapshots illustrate voltage-dependent fluorescence image spread, indicating increased cortical activity with paired white matter electrical stimulation at 40 Hz and 10 Hz (Left) or with only 10-Hz stimulation (Right) before (Upper) and after (Lower) 100 μM modafinil perfusion. (B) Pixel profiles recorded during 10-Hz (Upper) and 40-Hz stimulation (Lower) before (black) and after modafinil (red) (same slice as in A). (C) Three-dimensional VSDI elicited by thalamic VB 40-Hz paired shock stimulation before (control; Left) and after local micropressure (dotted lines; Right) of 100 μM modafinil. The VSDI results are superimposed on a phase-contrast image of the thalamocortical slice. (D) Profiles along cortical layer 5 after simultaneous 40-Hz (three pulses) and 10-Hz (two pulses) stimulation in control (Left) and 0.2 μM and 2 μM modafinil (Center and Right). Note the increased response resulting from the interaction of low and high frequencies after the second and third 40-Hz stimuli in the control panel (red arrow). Note how modafinil did reduce such activity (red arrows) (i.e., edge effect) (48).
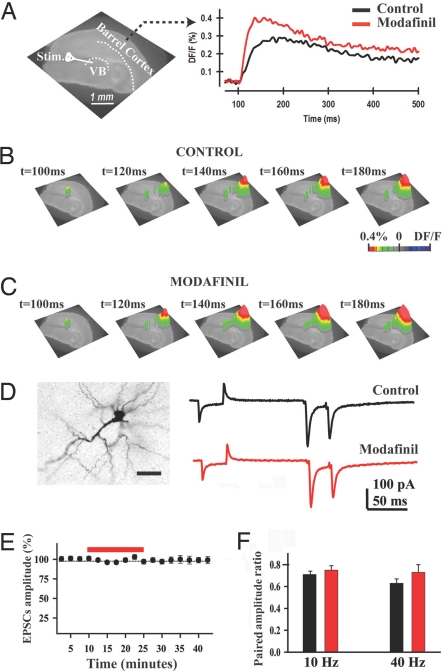
Modafinil facilitated thalamocortical activity in the absence of GABAergic inhibition. (A Left) Phase-contrast image of the thalamocortical slice showing the position of somatosensory barrel cortex and position of the VB stimulation electrode. (Right) Fluorescence profiles taken from a layer 4 pixel during paired-pulse stimulation before (black) and after 100 μM modafinil (red) in the presence of GABAA, GABAB, and NMDA blockers. (B and C) Three-dimensional VSDI images before (Control) and after local micropressure application of 100 μM modafinil (same slice as in A). (D Left) Representative biocityn-filled layer 4 interneuron. (Scale bar: 50 μm.) (Right) Representative EPSC recordings from the same layer 4 neuron before (black) and after a 15-min application of modafinil (red). (E and F) The EPSC amplitude was not changed over time (E), nor did the average amplitude ratios change (F).
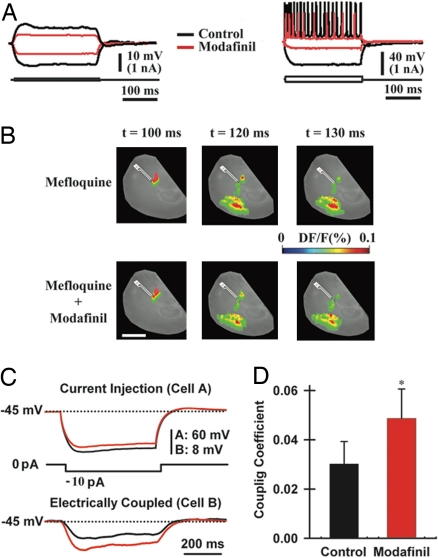
Modafinil increases electrotonic coupling among cortical interneurons. (A) Intracellular recordings from a pyramidal cell (Left) and an interneuron (Right) before (black) and after 50 μM modafinil (red). (B) VSDI responses after 50-min preincubation with mefloquine (50 μM, Upper) and 20 min after micropressure application of 50 μM modafinil to the cortex in the presence of mefloquine (Lower). (Scale bar, 1 mm.) (C) Dual-patch recording from a pair of cortical interneurons (in the presence of 2 μM tetrodotoxin) after the injection of a hyperpolarizing pulse into one neuron (cell A, Left) while recording the voltage deflection of the electrically coupled neuron (cell B, Right). (D) Mean coupling coefficients before (black bar; 0.030 ± 0.009) and after modafinil application (100 μM, red bar; 0.049 ± 0.012; n = 6 pairs). *, P = 0.02.
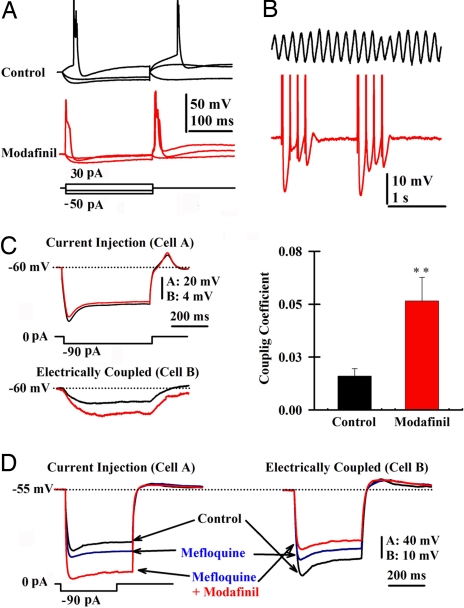
Modafinil increases electrotonic coupling among IO neurons. (A) Single-patch recording of membrane potential changes before (black) and after local modafinil application (150 μM, red). Note the increased input conductance. (B) Patch recordings of subthreshold oscillations in an IO neuron in control conditions (7 Hz, black) and after local application of modafinil (red). Modafinil made oscillation amplitude reach action potential threshold. (C Left) Superimposed membrane potential responses to a hyperpolarizing pulse before (black) and after modafinil (red) application recorded in a pair of IO neurons. (Right) Plot of mean coupling coefficient before (black; 0.016 ± 0.005) and after modafinil (150 μM, red bar; 0.052 ± 0.011; n = 7 pairs). **, P = 0.007. (D) Superimposed membrane potential responses in control (black), 50 μM mefloquine, and 150 μM modafinil in the presence of 2 μM tetrodotoxin. Note that the coupled neuron's membrane potential amplitude decreased even in the presence of modafinil.
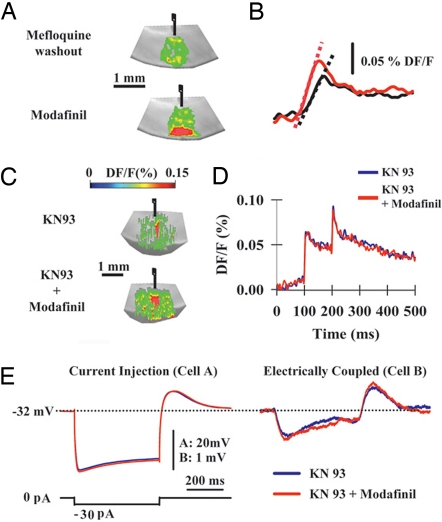
Modafinil coupling increase is CaMKII-dependent. (A) VSDI signals generated by single white matter stimulation after 50-min washout of mefloquine previously incubated at 20 μM for 45 min (Upper) and after (Lower) the micropressure application of 100 μM modafinil. Modafinil increased both area and amplitude of cortical VSDI responses. (B) Pixel profiles after washout of mefloquine and modafinil application shown in A. Slopes were 3.1 DF/F × ms−1 and 4.2 DF/F × ms−1 for washout (black line) and modafinil (red line) conditions, respectively. (C) VSDI signals generated in the presence of 10 μM KN-93 (inhibitor of CaMKII) and KN-93 + modafinil. (D) Pixel profiles in the presence of KN-93 (blue line) and KN-93 + modafinil (red line). (E) Superimposed responses of a dual-patch recorded pair of IO neurons (in 2 μM tetrodotoxin) in the presence of KN-93 (blue lines) and KN-93 + modafinil (red lines). The low resting potential is because of the presence of KN-93 (61).
References
Publication types
MeSH terms
Substances
Grants and funding
LinkOut - more resources
Full Text Sources
Other Literature Sources
Miscellaneous
