. 2007 Jul 31;104(31):12720-5.
doi: 10.1073/pnas.0705593104. Epub 2007 Jul 19.

Reevaluating the relationship between EPR spectra and enzyme structure for the iron sulfur clusters in NADH:quinone oxidoreductase

Affiliations

Reevaluating the relationship between EPR spectra and enzyme structure for the iron sulfur clusters in NADH:quinone oxidoreductase

Gregory Yakovlev et al. Proc Natl Acad Sci U S A. .

Abstract

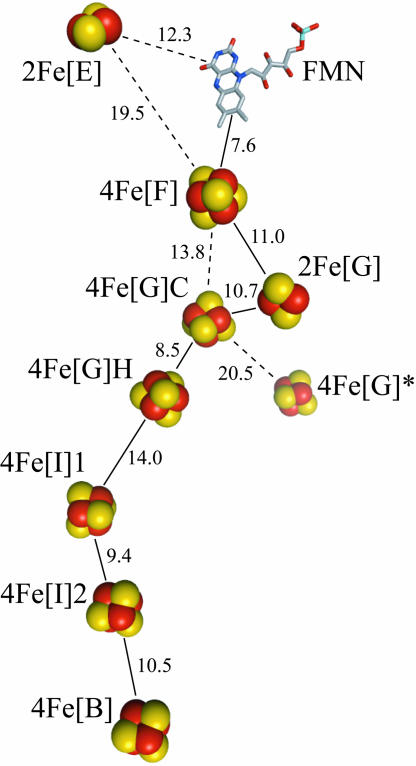
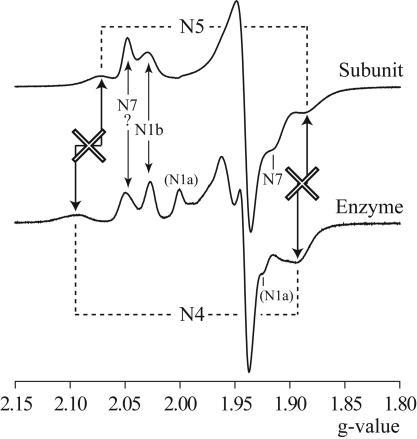
NADH:quinone oxidoreductase (complex I) plays a pivotal role in cellular energy production. It employs a series of redox cofactors to couple electron transfer to the generation of a proton-motive force across the inner mitochondrial or bacterial cytoplasmic membrane. Complex I contains a noncovalently bound flavin mononucleotide at the active site for NADH oxidation and eight or nine iron-sulfur clusters to transfer electrons between the flavin and a quinone-binding site. Understanding the mechanism of complex I requires the properties of these clusters to be defined, both individually and as an ensemble. Most functional information on the clusters has been gained from EPR spectroscopy, but some clusters are not observed by EPR and attributing the observed signals to the structurally defined clusters is difficult. The current consensus picture relies on correlating the spectra from overexpressed subunits (containing one to four clusters) with those from intact complexes I. Here, we analyze spectra from the overexpressed NuoG subunit from Escherichia coli complex I and compare them with spectra from the intact enzyme. Consequently, we propose that EPR signals N4 and N5 have been misassigned: signal N4 is from NuoI (not NuoG) and signal N5 is from the conserved cysteine-ligated [4Fe-4S] cluster in NuoG (not from the cluster with a histidine ligand). The consequences of reassigning the EPR signals and their associated functional information on the free energy profile for electron transfer through complex I are discussed.


Conflict of interest statement

The authors declare no conflict of interest.

Figures

Fig. 1.
Fig. 1.
Arrangement of the FMN and the FeS clusters in T. thermophilus complex I (5, 6). The clusters are named according to their nuclearity (2Fe or 4Fe), their subunit location (using the nomenclature for E. coli complex I, Table 1), and, when necessary, as ligated by four Cys (C) or three Cys and one His (H). The 4Fe[G]* cluster is not conserved in all species. Important edge-to-edge distances are indicated (Å), and the most likely electron transfer pathway is denoted by solid lines.
Fig. 2.
Fig. 2.
EPR spectra of EcNuoG. EcNuoG (≈20 mg·ml−1) was reduced anaerobically with 1 mM dithionite and frozen immediately. (A) The spectrum at 40 K shows predominantly the spectrum of one [2Fe-2S] cluster; the spectra at 12 and 5 K show the spectra of two [4Fe-4S] clusters also. g values for the major features are marked. Conditions are as follows: microwave power, 0.1 mW; conversion time, 81.92 ms; time constant, 20.48 ms; modulation amplitude, 10 G; microwave frequency, ≈9.38 MHz. (B) A model of the 12-K spectrum using the following parameters: gzyx = 2.074, 1.950, 1.887, Lzyx = 40, 25, 40 G (Gaussian); gzyx = 2.048, 1.942, 1.914, Lzyx = 13, 15, 25 G (Gaussian); gzyx = 2.030, 1.939, 1.937, Lzyx = 15, 20, 20 G (Lorentzian). The gz and gx pairs from the two [4Fe-4S] clusters are indicated.
Fig. 3.
Fig. 3.
Dependence of EcNuoG signal intensity on microwave power. (A) g = 2.03 at 40 K (modeled with Eq. 1, P½ = 20 mW, b = 1). (B) g = 2.05 at 12 K (P½ = 0.54 mW, b = 1). (C) g = 2.074 at 12 K [P½ = 5.8 mW, b = 1 (dashed) or P½ = 1.7 mW, b = 0.55 (solid line)]. (D) g = 2.074 at 5 K [P½ = 0.16 mW, b = 1 (dashed) or P½ = 0.6 μW, b = 0.37 (solid line)].
Fig. 4.
Fig. 4.
EPR spectra of isolated E. coli complex I. Complex I was dialyzed anaerobically against 20 mM Tris·HCl pH 7.5, 0.1 mM NADH for 1 h at 0°C, then reduced further by the addition of 1 mM dithionite and frozen immediately. (Top) Spectrum at 40 K comprising two [2Fe-2S] clusters. (Middle) Spectrum at 12 K comprising, in addition, at least two [4Fe-4S] clusters. (Bottom) Spectrum at 5 K comprising at least two [4Fe-4S] clusters and one [2Fe-2S] cluster. Conditions were as follows: microwave power, 0.1 mW; conversion time, 81.92 ms; time constant, 20.48 ms; modulation amplitude 10 G; microwave frequency, ≈9.38 MHz.
Fig. 5.
Fig. 5.
Comparison of EPR spectra from EcNuoG and E. coli complex I at 12 K. The two spectra are from Figs. 2 and 4. Arrows indicate correspondence between signals from the two spectra; crosses indicate that the signals do not match.

Similar articles

Cited by

References

    1. Walker JE. Q Rev Biophys. 1992;25:253–324. - PubMed
    1. Yagi T, Matsuno-Yagi A. Biochemistry. 2003;42:2266–2274. - PubMed
    1. Hirst J, Carroll J, Fearnley IM, Shannon RJ, Walker JE. Biochim Biophys Acta. 2003;1604:135–150. - PubMed
    1. Sazanov LA. Biochemistry. 2007;46:2275–2288. - PubMed
    1. Hinchliffe P, Sazanov LA. Science. 2005;309:771–774. - PubMed

Publication types

MeSH terms

LinkOut - more resources