. 2007 Jul 24;104(30):12347-52.
doi: 10.1073/pnas.0705282104. Epub 2007 Jul 18.

Sodium channels amplify spine potentials

Affiliations

Sodium channels amplify spine potentials

Roberto Araya et al. Proc Natl Acad Sci U S A. .

Abstract

Dendritic spines mediate most excitatory synapses in the brain. Past theoretical work and recent experimental evidence have suggested that spines could contain sodium channels. We tested this by measuring the effect of the sodium channel blocker tetrodotoxin (TTX) on depolarizations generated by two-photon uncaging of glutamate on spines from mouse neocortical pyramidal neurons. In practically all spines examined, uncaging potentials were significantly reduced by TTX. This effect was postsynaptic and spatially localized to the spine and occurred with uncaging potentials of different amplitudes and in spines of different neck lengths. Our data confirm that spines from neocortical pyramidal neurons are electrically isolated from the dendrite and indicate that they have sodium channels and are therefore excitable structures. Spine sodium channels could boost synaptic potentials and facilitate action potential backpropagation.


Conflict of interest statement

The authors declare no conflict of interest.

Figures

Fig. 1.
Fig. 1.
TTX reduces spine uncaging potentials. (A) Representative basal dendrite selected for uncaging from a layer 5 pyramidal neuron, filled with Alexa 488. (Scale bar, 5 μm.) (B) Representative spine uncaging experiments. (Left) Red dots indicate site of uncaging. (Center) Uncaging potentials under control conditions (black traces) and in TTX (red traces) in current clamp configuration. Dashed line is time of uncaging onset. Thicker traces are average of 10–15 depolarizations, and shaded areas illustrate ± SEM. (Right) Superimposition of average uncaging potentials. Note how TTX attenuates spine uncaging potentials. (Scale bar, 1 μm.)
Fig. 2.
Fig. 2.
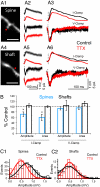
The effect of TTX is postsynaptic and restricted to spines. (A) Uncaging experiments in spine (A1–A3) or shaft (A4–A6) locations, under control conditions (black traces) and TTX (red traces) in current (top in A2, A3, A5, and A6) and voltage clamp (bottom in A2, A3, A5, and A6) configurations. (Scale bar, 3 μm.) Note lack of effect of TTX on spine voltage–clamp uncaging events and on shaft uncaging. (B) Uncaging potential amplitude and area (percentage from control) after TTX perfusion in spines (blue) and shafts (black), under current– and voltage–clamp configurations. *, P < 0.01. (C) Histogram of all individual uncaging potentials on spines (C1) and shafts (C2) in control and TTX. Note a shift toward smaller potentials caused by TTX in distribution of spine, but not shaft potentials.
Fig. 3.
Fig. 3.
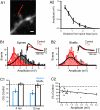
TTX effect on uncaging potentials of different amplitudes. (A) Spatial resolution of 10-msec uncaging pulses. (A1) Red dots are site of uncaging in a spine at different distance from its head. (Scale bar, 1 μm.) (A2) Uncaging potential amplitude at different distances from the spine head (mean ± SD). (B) Histogram of all 10-msec uncaging potentials on spines (B1) and shafts (B2) in control and TTX. Note that, as in 4-msec uncaging pulses, a shift toward smaller potentials is caused by TTX in the distribution of spine but not shaft potentials. (Inset) Black (control) and red (TTX) traces correspond to an average of 10–15 depolarizations in a spine (B1) or shaft location (B2). (C1) Percentage amplitude from control in spines and shafts under 4- and 10-msec stimulation pulses. *, P < 0.01. (C2) Plot of the percentage amplitude from control after TTX vs. the amplitude of the uncaging potentials.
Fig. 4.
Fig. 4.
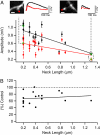
TTX effect on spines of different neck lengths. (A Upper) Examples of uncaging potentials in spines with a short (Left) and long (Right) neck. Red dots are site of uncaging. Voltage traces under control (black) and TTX (red), corresponding to averages of 10–15 uncaging potentials for each spine. (Scale bar, 1 μm.) In both short- and long-necked spines, a reduction in the uncaging potential by TTX is evident. (A Lower) Plot of uncaging potentials amplitude vs. neck length from spines examined in both control and TTX conditions. Each point corresponds to average amplitude of the uncaging potential from each spine in control and TTX, including the standard error of each data point. Line is linear regression. Green points are paired experiments illustrated in Upper. (B) Percent amplitude from control uncaging potentials in TTX vs. neck length. Line is linear regression.

References

    1. Ramón y, Cajal S. La Textura del Sistema Nervioso del Hombre y los Vertebrados. Madrid: Moya; 1899. Primera Edicion.
    1. Gray EG. J Anat. 1959;83:420–433. - PMC - PubMed
    1. Chang HT. Cold Spring Harbor Symp Quant Biol. 1952;17:189–202. - PubMed
    1. Llinás R, Hillman DE. In: Neurobiology of Cerebellar Evolution and Development. Llinas R, editor. Chicago: American Medical Association Education and Research Foundation; 1969. pp. 43–73.
    1. Diamond J, Gray EG, Yasargil GM. In: Excitatory Mechanisms, Proc 5th Internation Meeting of Neurobiologists. Andersen P, Jansen J, editors. Oslo: Universitets Forlaget; 1970. pp. 213–222.

Publication types

LinkOut - more resources