. 2007 Jul 24;104(30):12371-6.
doi: 10.1073/pnas.0704468104. Epub 2007 Jul 18.

Epigenetic characterization of hematopoietic stem cell differentiation using miniChIP and bisulfite sequencing analysis

Affiliations

Epigenetic characterization of hematopoietic stem cell differentiation using miniChIP and bisulfite sequencing analysis

Joanne L Attema et al. Proc Natl Acad Sci U S A. .

Abstract

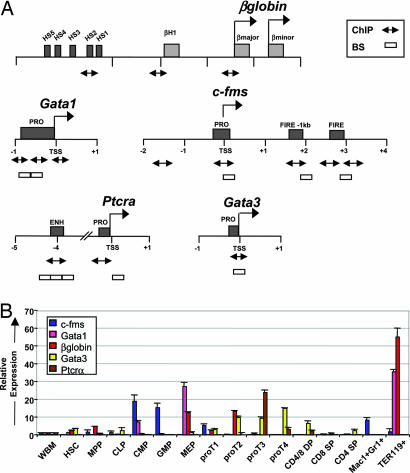
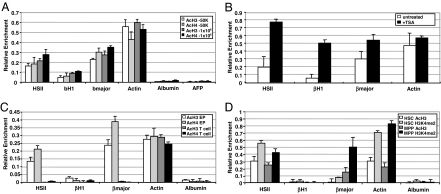
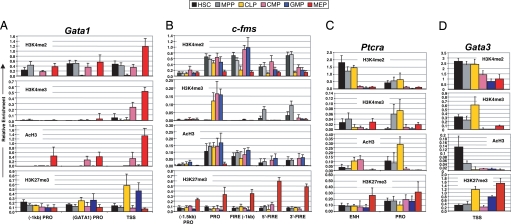
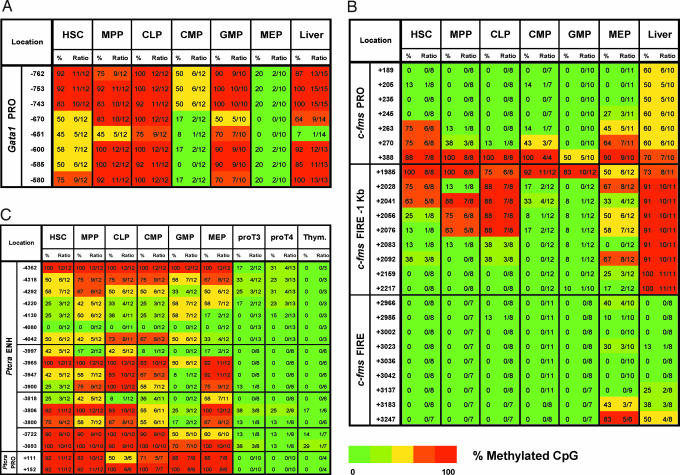
Hematopoietic stem cells (HSC) produce all blood cell lineages by virtue of their capacity to self-renew and differentiate into progenitors with decreasing cellular potential. Recent studies suggest that epigenetic mechanisms play an important role in controlling stem cell potency and cell fate decisions. To investigate this hypothesis in HSC, we have modified the conventional chromatin immunoprecipitation assay allowing for the analysis of 50,000 prospectively purified stem and progenitor cells. Together with bisulfite sequencing analysis, we found that methylated H3K4 and AcH3 and unmethylated CpG dinucleotides colocalize across defined regulatory regions of lineage-affiliated genes in HSC. These active epigenetic histone modifications either accumulated or were replaced by increased DNA methylation and H3K27 trimethylation in committed progenitors consistent with gene expression. We also observed bivalent histone modifications at a lymphoid-affiliated gene in HSC and downstream transit-amplifying progenitors. Together, these data support a model in which epigenetic modifications serve as an important mechanism to control HSC multipotency.


Conflict of interest statement

Conflict of interest statement: I.L.W. has stock in Amgen, Inc., was a member of the Amgen scientific advisory board, and is a cofounder and member of the Board of Directors of Cellerant, Inc., and Stem Cells, Inc.

Figures

Fig. 1.
Fig. 1.
Expression analysis of lineage-affiliated genes in purified hematopoietic cell subsets. (A) Locus maps of the β-globin, Gata1, c-fms, Ptcrα, and Gata3 regulatory regions. Numbers indicate the nucleotide position in kilobases relative to the TSS indicated by right-facing arrows. Dark gray boxes represent the regulatory regions, designated names of the elements are shown, and light gray boxes indicate coding regions of the β-globin genes. qRT-PCR products for ChIP assays are indicated by double-ended arrows. Open boxes indicate the amplicons for the BS analysis. (B) Distribution of lineage-affiliated gene expression. Expression of c-fms, β-globin, GATA1, GATA3, and Ptcrα in hematopoiesis as measured by qRT-PCR. Relative expression to BM after β-actin normalization is shown on the y axis by using the comparative Ct (2−ΔΔCt) method. Error bars represent mean ± SD of three independent sort experiments.
Fig. 2.
Fig. 2.
Establishment of the miniChIP assay. (A) Comparison of histone modifications detected at the β-globin locus in 1 × 10⁶ and 50,000 MEL cells. Gene-specific enrichment was examined by qRT-PCR. IgG background was subtracted from the histone-specific antibody enrichment values. Error bars represent the mean ± SD of six independent experiments. (B) MiniChIP analysis of 50,000 TSA-treated MEL cells using antibodies to AcH4. Open bars represent enrichment values in the untreated control, and black bars indicate AcH4 levels in cells treated with TSA. (C) MiniChIP analysis of 50,000 primary EP and splenic CD4+ T cells with antibodies against acetylated histones H3 and H4. (D) MiniChIP assays using antibodies specific for AcH3 and H3K4me2 in 50,000 HSC and MPP. Error bars represent the mean ± SD of three independent experiments.
Fig. 3.
Fig. 3.
Active histone modifications associate with lineage-affiliated genes during early hematopoiesis. MiniChIP analysis of H3K4me2, H3K4me3, AcH3, and H3K27me3 levels at the regulatory regions of Gata1 (A), c-fms (B), Ptcrα (C), and Gata3 (D) genes in HSC (black bars), MPP (gray bars), CLP (yellow bars), CMP (pink bars), GMP (blue bars), and MEP (red bars) using qRT-PCR. Error bars represent the mean ± SD of three independent miniChIP experiments.
Fig. 4.
Fig. 4.
HSC and committed progenitors exhibit distinct DNA methylation patterns. BS analysis across the regulatory regions of Gata1 (A), c-fms (B), and Ptcrα (C) genes in HSC, MPP, CLP, CMP, GMP, MEP, proT3, proT4, and liver cells. Results obtained for the Ptcrα gene are also described in ref. . The percent methylation of each CpG dinucleotide was determined by the number of methylated clones in the total number of clones sequenced as indicated in the heat map ranging from 100% methylated (red) to 0% methylated (green).

Similar articles

Cited by

References

    1. Shizuru JA, Negrin RS, Weissman IL. Annu Rev Med. 2005;56:509–538. - PubMed
    1. Kondo M, Wagers AJ, Manz MG, Prohaska SS, Scherer DC, Beilhack GF, Shizuru JA, Weissman IL. Annu Rev Immunol. 2003;21:759–806. - PubMed
    1. de Haan G, Gerrits A, Bystrykh L. Curr Opin Hematol. 2006;13:249–253. - PubMed
    1. Loose M, Patient R. Curr Opin Hematol. 2006;13:229–236. - PubMed
    1. Ivanova NB, Dimos JT, Schaniel C, Hackney JA, Moore KA, Lemischka IR. Science. 2002;298:601–604. - PubMed

Publication types

MeSH terms