. 2007 Jul 24;104(30):12434-9.
doi: 10.1073/pnas.0703510104. Epub 2007 Jul 18.

Poor correlation between BCG vaccination-induced T cell responses and protection against tuberculosis

Affiliations

Poor correlation between BCG vaccination-induced T cell responses and protection against tuberculosis

Hans-Willi Mittrücker et al. Proc Natl Acad Sci U S A. .

Abstract

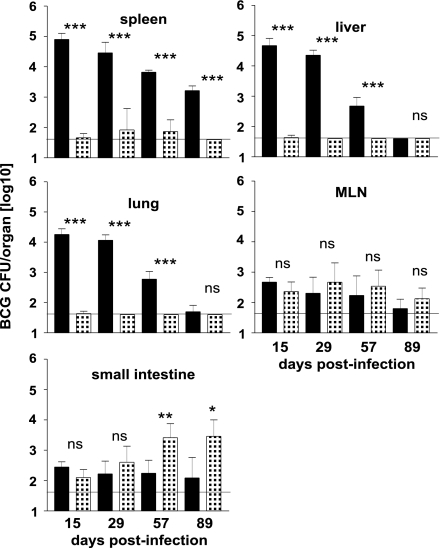
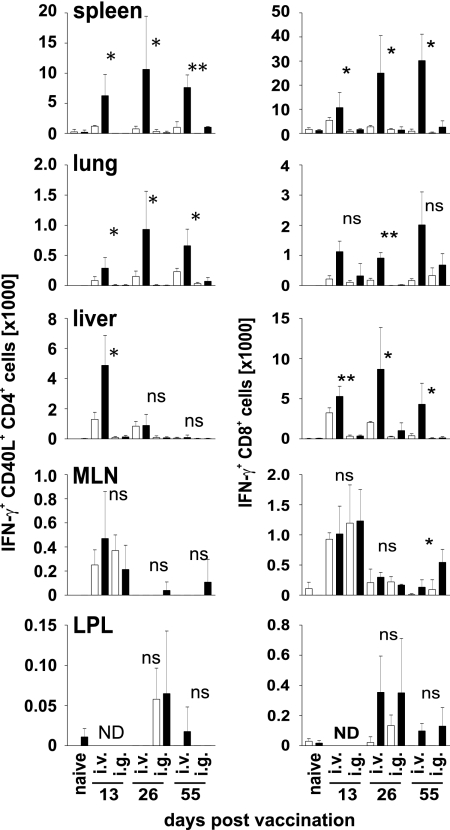
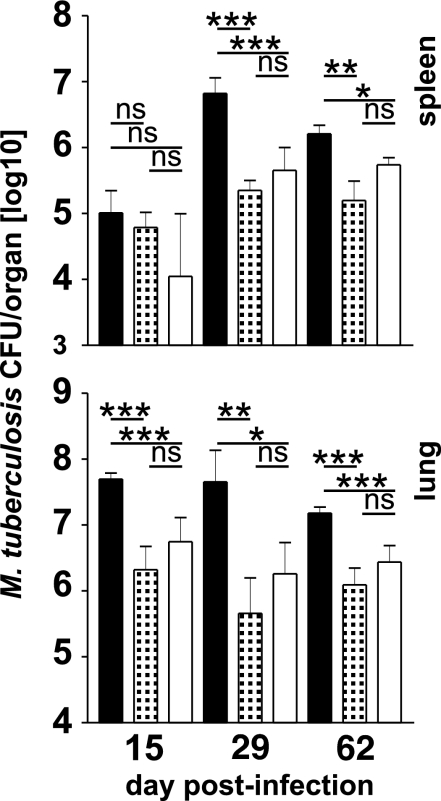
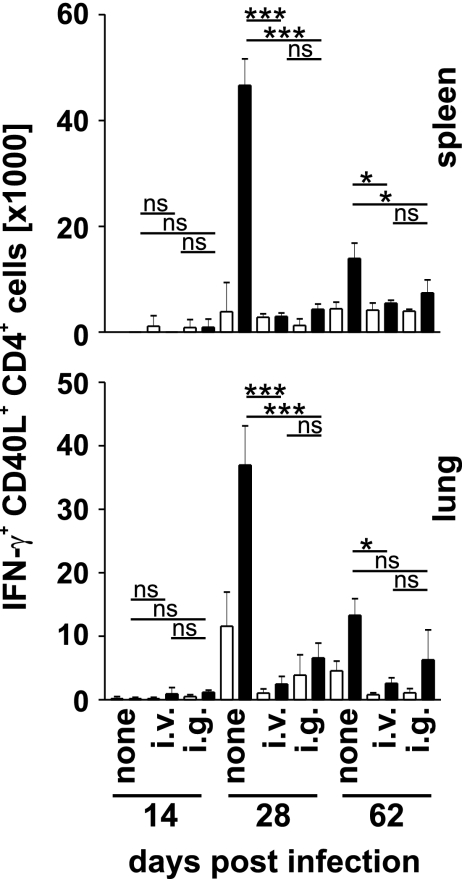
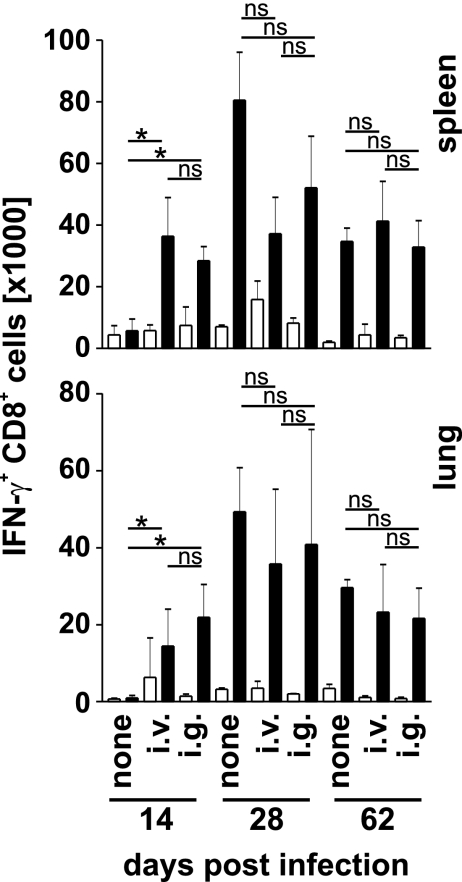
Mycobacterium bovis bacille Calmette-Guérin (BCG) is the most widely used live bacterial vaccine. However, limited information is available correlating route and dose of vaccination and induction of specific T cell responses with protection against tuberculosis. We compared efficacy of oral and systemic vaccination and correlated vaccine-induced T cell responses with protection in experimental tuberculosis of mice. After oral and systemic vaccination, we observed profound differences in persistence and dissemination of BCG and frequencies and location of specific IFN-gamma-secreting CD4(+) and CD8(+) T cells. Yet, both vaccination routes caused comparable levels of protection against aerosol challenge with Mycobacterium tuberculosis. Protection correlated best with rapid accumulation of specific CD8(+) T cells in infected tissues of challenged mice. In contrast, specific IFN-gamma production by CD4(+) T cells reflected the load of M. tuberculosis rather than the strength of protection. Our data question the measurement of IFN-gamma secretion by CD4(+) T cells and emphasize the need for new biomarkers for evaluation of tuberculosis vaccine efficacies.


Conflict of interest statement

The authors declare no conflict of interest.

Figures

Fig. 1.
Fig. 1.
Dissemination and persistence of BCG after different routes of vaccination. C57BL/6 mice were vaccinated with 106 or 109 BCG organisms via the i.v. (black bars) or the i.g. route (patterned bars), respectively. Titers were determined in spleen, liver, lung, MLN, and small intestine (tissue plus luminal content). Bars represent means ± SD of titers of five individually analyzed animals per group and time point. The horizontal line indicates the limit of detection (40 CFU per tissue). *, P < 0.05; **, P < 0.01; ***, P < 0.001; ns, P > 0.05.
Fig. 2.
Fig. 2.
Specific T cell responses in BCG-vaccinated mice. C57BL/6 mice were i.v. or i.g. vaccinated, and cells isolated from indicated tissues were restimulated in vitro with Ag85A241–260 and Ag85B240–260 or with Mtb32309–318 to stimulate mycobacteria-specific CD4+ and CD8+ T cells, respectively. Cells were analyzed as described in Materials and Methods. Graphs show total numbers of IFN-γ+ CD40L+ CD4+ T cells (Left) or total numbers of IFN-γ+ CD8+ T cells (Right) isolated from different tissues and days after infection, as indicated. Age-matched naïve mice were included in the analyses at each time point. Because we never detected mycobacteria-specific T cell responses in naïve mice, only one representative set of data is shown (indicated as naïve). Open and filled bars indicate incubation without or with peptide, respectively. Bars give mean ± SD for cells from three individually analyzed mice. ND, not determined. *, P < 0.05; **, P < 0.01; ns, P > 0.05.
Fig. 3.
Fig. 3.
Protection against tuberculosis in BCG-vaccinated mice. C57BL6 were vaccinated with BCG via the i.v. (patterned bars) or the i.g. (white bars) route as described in the legend of Fig. 1. After 99 days, vaccinated and age-matched naïve mice (black bars) were aerosol infected with ≈200 CFU of M. tuberculosis. After 15, 29, and 62 days, mycobacterial titers in spleen and lung of animals were determined. Bars represent mean ± SD of titers of five individually analyzed animals per group and time point. *, P < 0.05; **, P < 0.01; ***, P < 0.001; ns, P > 0.05.
Fig. 4.
Fig. 4.
Specific CD4+ T cell responses in BCG-vaccinated and M. tuberculosis-challenged mice. C57BL/6 mice were treated and analyzed as described in the legends of Figs. 2 and 4. Graphs show results total numbers of Ag85A241–260- and Ag85B240–260-specific IFN-γ+ CD40L+ CD4+ T cells in spleen and lung at the indicated day after M. tuberculosis infection. Open and filled bars indicate incubation without and with peptide, respectively. Bars give mean ± SD for cells from three individually analyzed mice. *, P < 0.05; ***, P < 0.001; ns, P > 0.05.
Fig. 5.
Fig. 5.
Specific CD8+ T cell responses in BCG-vaccinated and M. tuberculosis-challenged mice. C57BL/6 mice were treated and analyzed as described in the legends of Figs. 2 and 4. Graphs show results total numbers of Mtb32309–3180-specific IFN-γ+ CD8+ T cells in spleen and lung at the indicated day after M. tuberculosis infection. Open and filled bars indicate incubation without and with peptide, respectively. Bars give mean ± SD for cells from three individually analyzed mice. *, P < 0.05; ns, P > 0.05.

References

    1. World Health Organization. 2006. Fact Sheet No 104, Rev March 2006, www.who.int/mediacentre/factsheets/fs104/en.
    1. Calmette A, Guérin C. Ann Inst Pasteur. 1924;38:371–398.
    1. Fine PE. Scand J Infect. 2001;33:243–245. - PubMed
    1. Kaufmann SHE. Nat Rev Immunol. 2006;6:699–704. - PubMed
    1. Mogues T, Goodrich ME, Ryan L, LaCourse R, North RJ. J Exp Med. 2001;193:271–280. - PMC - PubMed

Publication types