. 2007 Sep 15;583(Pt 3):1117-27.
doi: 10.1113/jphysiol.2007.133264. Epub 2007 Jul 19.

Frequency response of human vestibular reflexes characterized by stochastic stimuli

Affiliations

Frequency response of human vestibular reflexes characterized by stochastic stimuli

Christopher J Dakin et al. J Physiol. .

Abstract

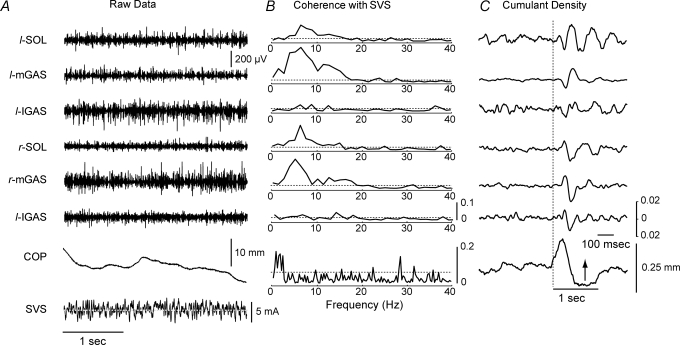
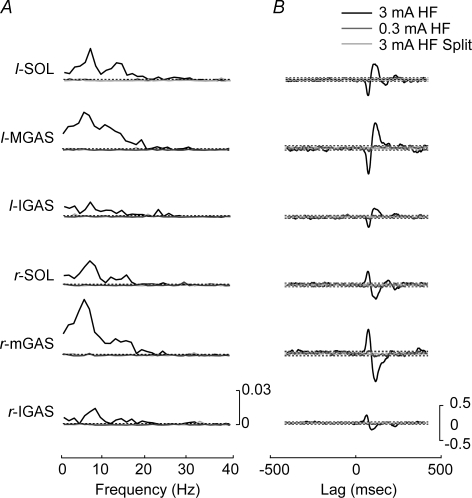
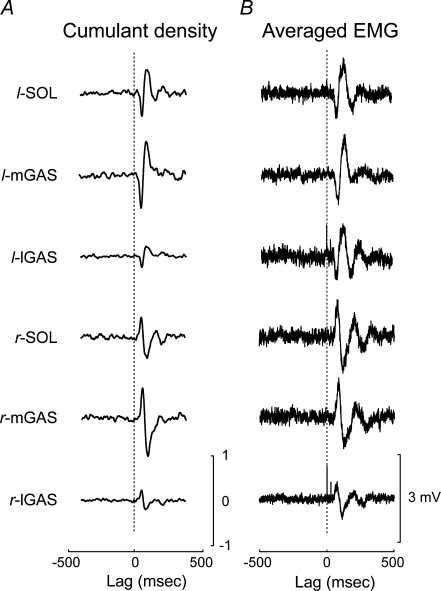
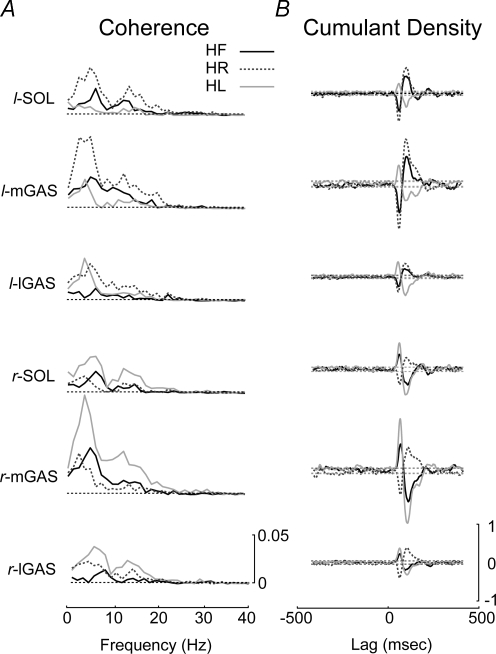
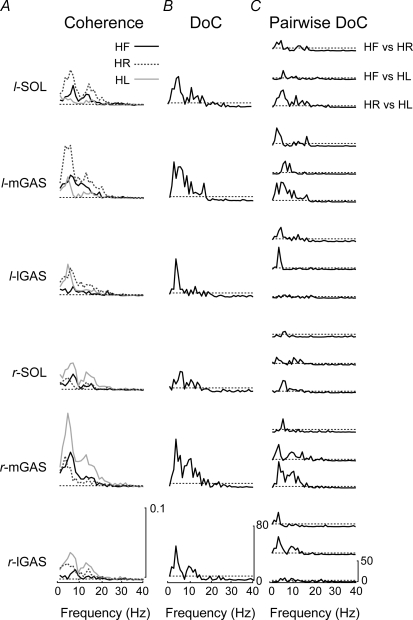
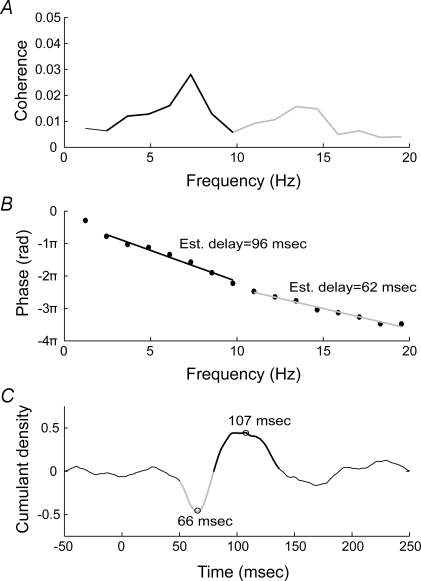
Stochastic vestibular stimulation (SVS) can be used to study the postural responses to unpredictable vestibular perturbations. The present study seeks to determine if stochastic vestibular stimulation elicits lower limb muscular responses and to estimate the frequency characteristics of these vestibulo-motor responses in humans. Fourteen healthy subjects were exposed to unpredictable galvanic currents applied on their mastoid processes while quietly standing (+/-3 mA, 0-50 Hz). The current amplitude and stimulation configuration as well as the subject's head position relative to their feet were manipulated in order to determine that: (1) the muscle responses evoked by stochastic currents are dependent on the amplitude of the current, (2) the muscle responses evoked by stochastic currents are specific to the percutaneous stimulation of vestibular afferents and (3) the lower limb muscle responses exhibit polarity changes with different head positions as previously described for square-wave galvanic vestibular stimulation (GVS) pulses. Our results revealed significant coherence (between 0 and 20 Hz) and cumulant density functions (peak responses at 65 and 103 ms) between SVS and the lower limbs' postural muscle activity. The polarity of the cumulant density functions corresponded to that of the reflexes elicited by square-wave GVS pulses. The SVS-muscle activity coherence and time cumulant functions were modulated by current amplitude, electrode position and head orientation with respect to the subject's feet. These findings strongly support the vestibular origin of the lower limb muscles evoked by SVS. In addition, specific frequency bandwidths in the stochastic vestibular signal contributed to the early (12-20 Hz) and late components (2-10 Hz) of the SVS-evoked muscular responses. These frequency-dependent SVS-evoked muscle responses support the view that the biphasic muscle response is conveyed by two distinct physiological processes.


Figures

Figure 1
Figure 1
Raw data from a single subject exposed to SVS with the head facing forwards A, 3 s of raw data comprising EMG for the six measured muscles, medio-lateral centre of foot pressure (COP) and SVS (horizontal dashed line indicates 0 mA mark for SVS). B, corresponding coherence plots for each of the six muscle groups. The bottom plot is the coherence plot between the SVS and the COP trace. Coherence exhibited between the SVS–EMG signals is localized between 1 and 20 Hz and coherence between the SVS–COP signals is localized in the 0–3 Hz bandwidth. Horizontal dashed lines indicate the 95% confidence limit. C, cumulant density estimates for the six measured muscles displaying a biphasic response. The bottom plot shows changes in COP associated with the SVS (note the different time scale for this plot; arrow indicates movement of COP to the left). COP, centre of pressure; SVS, stochastic vestibular stimulation; SOL, soleus; mGAS, medial head of gastrocnemius; lGAS, lateral head of gastrocnemius; l, left; r, right.
Figure 2
Figure 2
Pooled comparison of 3 mA head forward condition with 0.3 mA and split head forward conditions A, pooled (n = 10) coherence plots for each of the six lower limb muscles comparing the 3 mA head forward, 0.3 mA head forward and the 3 mA head forward split electrode conditions. Horizontal dashed lines indicate the 95% confidence limit. Significant coherence levels were observed only for the 3 mA head forward condition. B, pooled (n = 10) cumulant density estimates for each of the six lower limb muscles comparing the 3 mA head forward, 0.3 mA head forward and the 3 mA head forward split electrode conditions. The horizontal dashed lines represent the 95% confidence interval. Significance levels were only reached in the 3 mA head forward condition. HF, head forward; Split, split electrode condition with electrodes on the forehead and on the spinous process of C7; SOL, soleus; mGAS, medial head of gastrocnemius; lGAS, lateral head of gastrocnemius; l: left; r: right.
Figure 3
Figure 3
Pooled comparison of cumulant density estimates to the EMG responses evoked by square-wave GVS pulses A, pooled (n = 10) cumulant density estimates for each of the six muscle groups derived from the SVS in the head forward condition. The vertical dashed line indicates zero lag mark between the SVS and muscle activity. B, pooled (n = 10) spike trigger averaged EMG corresponding to the square-wave pulse trials with participants head's forward. The vertical dashed line indicates the onset of the square-wave GVS pulse. SOL, soleus; mGAS, medial head of gastrocnemius; lGAS, lateral head of gastrocnemius; l: left; r: right.
Figure 4
Figure 4
Coherence and cumulant density estimates for the different head positions A, pooled (n = 10) coherence plots between the SVS and the muscle activity for the head forward, head right and head left conditions. Significant coherence was observed in all muscles for the three head positions. Coherence was larger in the limb opposite to the head turn (right leg when the head is turned to the left). The horizontal dashed lines represent the 95% confidence limit. B, pooled (n = 10) cumulant density estimate showing the presence of a biphasic response reversing in polarity between the head right and head left conditions. The dashed line represents the 95% confidence interval. HR, head right; HL, head left; SOL, soleus; mGAS, medial head of gastrocnemius; lGAS, lateral head of gastrocnemius; l: left; r: right.
Figure 5
Figure 5
Comparison of different head positions A, superimposed pooled (n = 10) coherence plots for each of the head position conditions for each of the six muscle groups. The largest SVS–EMG coherence was seen in the medial gastrocnemius of the limb opposite to the head turn. The horizontal dashed lines indicate the 95% confidence limit. B, difference of coherence test for all three head positions and all six muscles displaying significant differences in coherence between the three head positions. Horizontal segmented lines represents the significance level for the χ2 distribution (P = 0.05). C, difference of coherence test between each pair of head positions across all six muscle groups. The horizontal segmented lines represents the significance level for the χ2 distribution (P = 0.05). The medial head of the gastrocnemius showed the largest coherence changes across different head positions. HF, head forward; HR, head right; HL, head left; DoC, difference of coherence test; SOL, soleus; mGAS, medial head of gastrocnemius; lGAS, lateral head of gastrocnemius; l: left; r: right.
Figure 6
Figure 6
Relationship between coherence, phase estimation and cumulant density for the left soleus A, pooled coherence (n = 10) for the head forward condition in the left soleus. Coherence estimate displays two peaks, the first between 2 and 10 Hz and the second between 11 and 20 Hz. B, phase estimates between the SVS and the muscle activity at various frequencies. Typically, phase estimates cycle between −π and π; here the phase estimates have been reset to display the points corresponding to the frequency bandwidths of interest on a continuous slope. Linear regression was used to compute a slope for the phase points corresponding to the regions of interest in the coherence estimate. The slope of the phase points provide the lag of the EMG signal with respect to the SVS signal for a particular frequency bandwidth. C, the peaks in the biphasic cumulant density estimate correspond to the lags estimated for the slope of the phase between the SVS and muscle signals. The early component of the biphasic cumulant density function is associated with the high-frequency bandwidth of the coherence plot (11–20 Hz) and second peak in the cumulant density function is associated with the low-frequency bandwidth (2–10 Hz).

Similar articles

Cited by

References

    1. Ali AS, Rowen KA, Iles JF. Vestibular actions on back and lower limb muscles during postural tasks in man. J Physiol. 2003;546:615–624. - PMC - PubMed
    1. Amjad AM, Halliday DM, Rosenberg JR, Conway BA. An extended difference of coherence test for comparing and combining several independent coherence estimates: Theory and application to the study of motor units and physiological tremor. J Neurosci Meth. 1997;73:69–79. - PubMed
    1. Blouin JS, Inglis JT, Siegmund GP. Startle responses elicited by whiplash perturbations. J Physiol. 2006;573:857–867. - PMC - PubMed
    1. Brillinger DR. Cross-spectral analysis of processes with stationary increments including the stationary. Ann Probability. 1974;2:815–827.
    1. Britton TC, Day BL, Brown P, Rothwell JC, Thompson PD, Marsden CD. Postural electromyographic responses in the arm and leg following galvanic vestibular stimulation in man. Exp Brain Res. 1993;94:143–151. - PubMed

Publication types