. 2007 Sep 15;583(Pt 3):1129-43.
doi: 10.1113/jphysiol.2007.139592. Epub 2007 Jul 19.

Intravenous hypertonic NaCl acts via cerebral sodium-sensitive and angiotensinergic mechanisms to improve cardiac function in haemorrhaged conscious sheep

Affiliations

Intravenous hypertonic NaCl acts via cerebral sodium-sensitive and angiotensinergic mechanisms to improve cardiac function in haemorrhaged conscious sheep

Robert Frithiof et al. J Physiol. .

Abstract

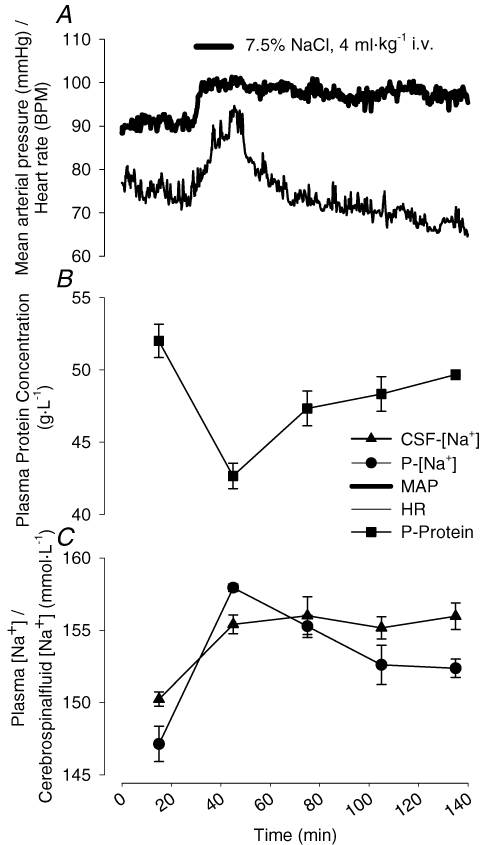
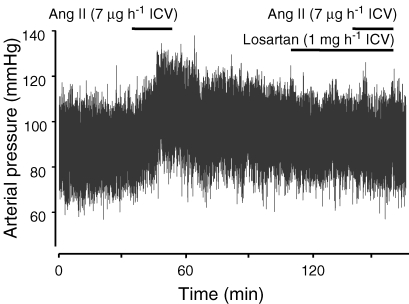
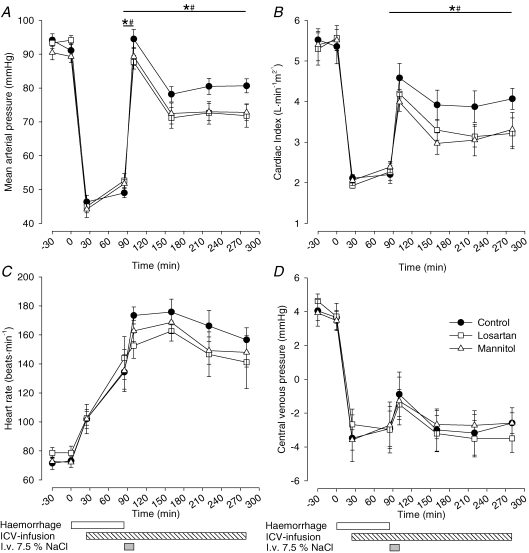
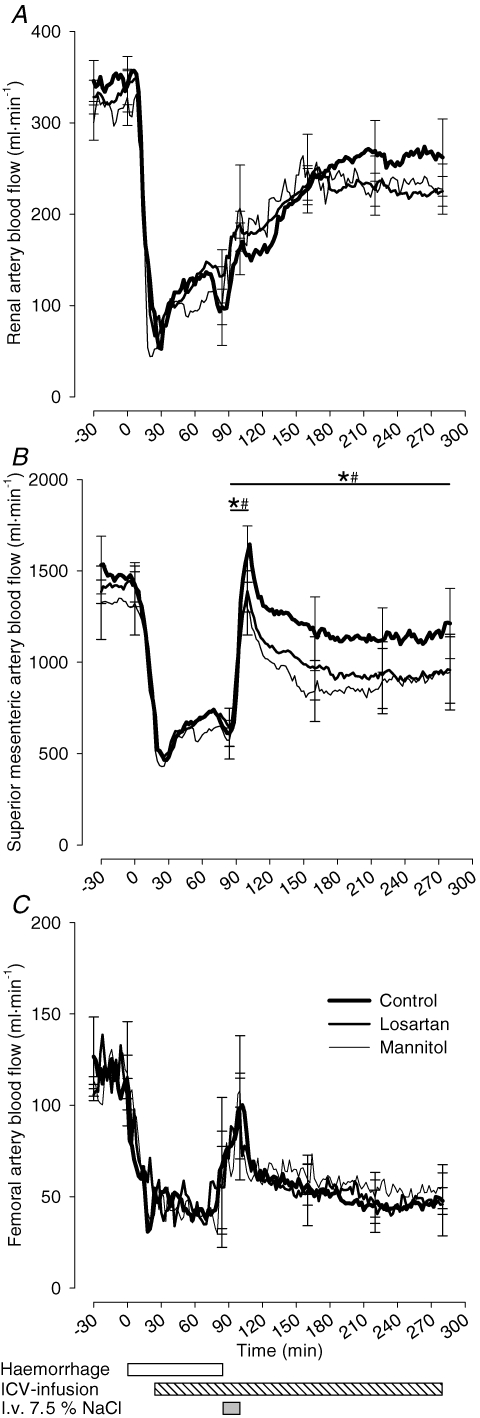
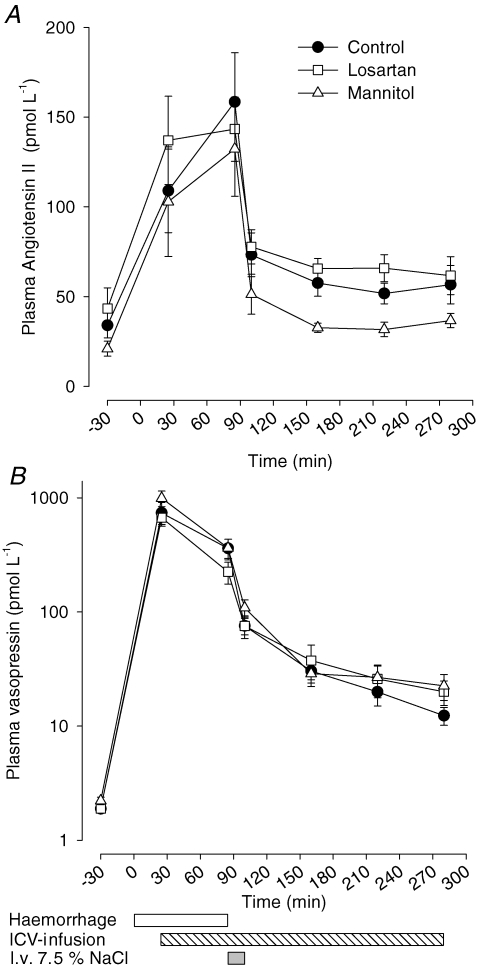
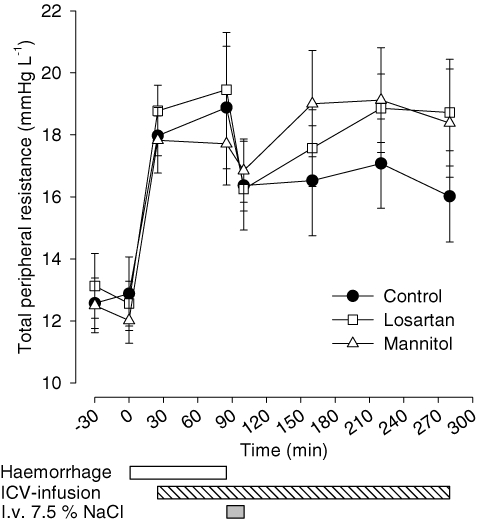
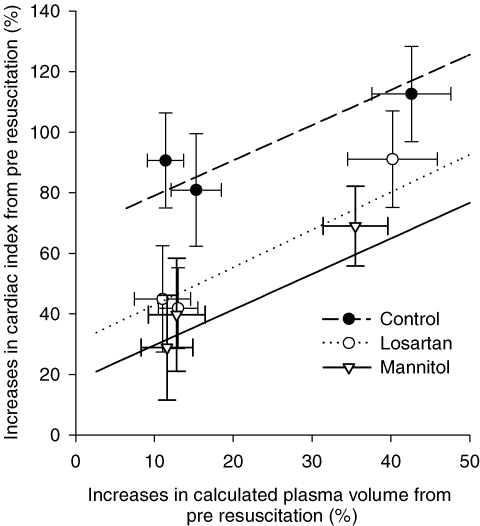
Acute NaCl loading as resuscitation in haemorrhagic hypovolaemia is known to induce rapid cardiovascular recovery. Besides an osmotically induced increase in plasma volume the physiological mechanisms of action are unknown. We hypothesized that a CNS mechanism, elicited by increased periventricular [Na(+)] and mediated by angiotensin II type 1 receptors (AT(1)), is obligatory for the full effect of hypertonic NaCl. To test this we investigated the cardiovascular responses to haemorrhage and subsequent hypertonic NaCl infusion (7.5% NaCl, 4 ml (kg BW)(-1)) in six conscious sheep subjected to intracerebroventricular (i.c.v.) infusion of artificial cerebrospinal fluid (aCSF; control), mannitol solution (Man; 75 mmol l(-1) [Na(+)], total osmolality 295 mosmol kg(-1)) or losartan (Los; 1 mg ml(-1), AT(1) receptor antagonist) at three different occasions. Man normalized (144 +/- 6 mmol l(-1), mean +/- s.d.) the increase in i.c.v. [Na(+)] seen after aCSF (161 +/- 2 mmol l(-1)). Compared with control, both Man and Los significantly (P < 0.05) attenuated the improvement in mean arterial blood pressure (MAP), cardiac index and mesenteric blood flow (SMBF) in response to intravenous hypertonic NaCl: MAP, rapid response +45 mmHg versus +38 mmHg (Man) and +35 mmHg (Los); after 180 min, +32 mmHg versus +21 mmHg (Man) and +19 mmHg (Los); cardiac index after 180 min, +1.9 l min(-1) (m(2))(-1) versus +0.9 l min(-1) (m(2))(-1) (Man) and +0.9 l min(-1) (m(2))(-1) (Los); SMBF rapid response, +981 ml min(-1) versus +719 ml min(-1) (Man) and +744 ml min(-1) (Los); after 180 min, +602 ml min(-1) versus +372 ml min(-1) (Man) and +314 ml min(-1) (Los). The results suggest that increased periventricular [Na(+)] and cerebral AT(1) receptors contribute, together with plasma volume expansion, to improve systemic haemodynamics after treatment with hypertonic NaCl in haemorrhagic hypovolaemia.


Figures

Figure 1
Figure 1
Effects of an intravenous (i.v.) infusion of 7.5% NaCl (4 ml kg−1) in three normovolaemic sheep After 30 min of baseline registration, hypertonic NaCl was infused intravenously during 15 min. Blood and cerebrospinal fluid were sampled before hypertonic NaCl and every 30 min starting at the end of the infusion. Data are expressed as mean ±s.e.m. except in A where spreads are omitted to improve clarity. P, plasma.
Figure 2
Figure 2
Changes in arterial blood pressure in one sheep in response to i.c.v. infusion of angiotensin II with or without concomitant i.c.v. infusion of the AT1 antagonist losartan Angiotensin II (Ang II) was first solely infused i.c.v. for 20 min (7 μg h−1). When MAP had normalized the Ang II infusion was repeated 30 min into an i.c.v. infusion of losartan (1 mg h−1).
Figure 3
Figure 3
Systemic haemodynamic variables in six sheep subjected to haemorrhage and subsequent i.v. hypertonic NaCl in relation to different i.c.v. infusions Baseline registration was followed by haemorrhage at 1 ml kg −1 min−1. After 25 min, the i.c.v. infusion (1 ml h−1) was started and the haemorrhage rate decreased to remove an additional 10 ml kg−1 for the following 60 min. At 85 min haemorrhage was stopped and 7.5% NaCl (4 ml kg−1) infused i.v. for 15 min. The i.c.v. infusion was discontinued at 280 min. The i.c.v. infusion consisted of: control, artificial cerebrospinal fluid; losartan, AT1 receptor antagonist, 1 mg ml−1; mannitol, an iso-osmolar solution with 75 mm Na+ and 150 mmol l−1 mannitol. Data are expressed as mean ±s.e.m. Significant (P < 0.05) differences in response to i.v. hypertonic NaCl compared with control are indicated by *(i.c.v. losartan) and # (i.c.v. mannitol). The analysis was performed between the time points indicated by the bar.
Figure 4
Figure 4
Regional blood flow in six sheep subjected to haemorrhage and subsequent i.v. hypertonic NaCl in relation to different i.c.v. infusions Baseline registration was followed by haemorrhage at 1 ml kg −1 min−1. After 25 min the i.c.v. infusion (1 ml h−1) was started and the haemorrhage rate decreased to remove an additional 10 ml kg−1 for the following 60 min. At 85 min haemorrhage was stopped and 7.5% NaCl (4 ml kg−1) infused i.v. for 15 min. The i.c.v. infusion was discontinued at 280 min. The i.c.v. infusion consisted of: control, artificial cerebrospinal fluid; losartan, AT1 receptor antagonist, 1 mg ml−1; mannitol, an iso-osmolar solution with 75 mm Na+ and 150 mmol l−1 mannitol. Data are expressed as mean ±s.e.m. Significant (P < 0.05) differences in response to i.v. hypertonic NaCl compared with control are indicated by *(i.c.v. losartan) and # (i.c.v. mannitol). The analysis was performed between the time points indicated by the bar.
Figure 5
Figure 5
Changes in plasma vasopressin and angiotensin II concentrations in six sheep subjected to haemorrhage and subsequent i.v. hypertonic NaCl in relation to different i.c.v. infusions Baseline registration was followed by haemorrhage at 1 ml kg −1 min−1. After 25 min the i.c.v. infusion (1 ml h−1) was started and the haemorrhage rate decreased to remove an additional 10 ml kg−1 for the following 60 min. At 85 min haemorrhage was stopped and 7.5% NaCl (4 ml kg−1) infused i.v. for 15 min. The i.c.v. infusion was discontinued at 280 min. The i.c.v. infusion consisted of: control, artificial cerebrospinal fluid; losartan, AT1 receptor antagonist, 1 mg ml−1; mannitol, an iso-osmolar solution with 75 mm Na+ and 150 mmol l−1 mannitol. Data are expressed as mean ±s.e.m. For statistical calculations please refer to the Results section.
Figure 6
Figure 6
Total peripheral resistance (TPR) in six sheep subjected to haemorrhage and subsequent i.v. hypertonic NaCl in relation to different i.c.v. infusions Baseline registration was followed by haemorrhage at 1 ml kg −1 min−1. After 25 min, the i.c.v. infusion (1 ml h−1) was started and the haemorrhage rate decreased to remove an additional 10 ml kg−1 for the following 60 min. At 85 min haemorrhage was stopped and 7.5% NaCl (4 ml kg−1) infused i.v. for 15 min. The i.c.v. infusion was discontinued at 280 min. The i.c.v. infusion consisted of: control, artificial cerebrospinal fluid; losartan, AT1 receptor antagonist, 1 mg ml−1; mannitol, an iso-osmolar solution with 75 mm Na+ and 150 mmol l−1 mannitol. Data are expressed as mean ±s.e.m. No significant differences between the i.c.v. infusions in response to hypertonic NaCl were detected.
Figure 7
Figure 7
Changes in cardiac index after i.v. hypertonic NaCl (7.5%, 4 ml kg−1) plotted against changes in calculated plasma volume in six haemorrhaged (35 ml kg−1) sheep subjected to different i.c.v. infusions The cardiac index and plasma volume data are derived from 0 min, 120 min and 180 min after hypertonic NaCl and related to values directly before hypertonic NaCl was infused. Data from 60 min after hypertonic NaCl are omitted for clarity but included in the calculation of the regression lines (in total 24 observations in each line). The plasma volume changes are based on changes in plasma protein concentration. The i.c.v. infusion consisted of: control, artificial cerebrospinal fluid; losartan, AT1 receptor antagonist, 1 mg ml−1; mannitol, 75 mm Na+ in an iso-osmolar mannitol solution. Data are expressed as mean ±s.e.m.

Similar articles

Cited by

References

    1. Andersson B, Eriksson L, Fernandez O, Kolmodin CG, Oltner R. Centrally mediated effects of sodium and angiotensin II on arterial blood pressure and fluid balance. Acta Physiol Scand. 1972;85:398–407. - PubMed
    1. Andersson B, Jobin M, Olsson K. A study of thirst and other effects of an increased sodium concentration in the 3rd brain ventricle. Acta Physiol Scand. 1967;69:29–36. - PubMed
    1. Antunes VR, Yao ST, Pickering AE, Murphy D, Paton JF. A spinal vasopressinergic mechanism mediates hyperosmolality-induced sympathoexcitation. J Physiol. 2006;576:569–583. - PMC - PubMed
    1. Barbosa SP, Camargo LA, Saad WA, Renzi A, Luca Junior LA, Menani JV. Lesion of the anteroventral third ventricle region impairs the recovery of arterial pressure induced by hypertonic saline in rats submitted to hemorrhagic shock. Brain Res. 1992;587:109–114. - PubMed
    1. Blair-West JR, Burns P, Denton DA, Ferraro T, McBurnie MI, Tarjan E, Weisinger RS. Thirst induced by increasing brain sodium concentration is mediated by brain angiotensin. Brain Res. 1994;637:335–338. - PubMed

Publication types

MeSH terms