. 2007 Aug;117(8):2302-12.
doi: 10.1172/JCI31602.

Type II NKT cell-mediated anergy induction in type I NKT cells prevents inflammatory liver disease

Affiliations

Type II NKT cell-mediated anergy induction in type I NKT cells prevents inflammatory liver disease

Ramesh C Halder et al. J Clin Invest. 2007 Aug.

Abstract

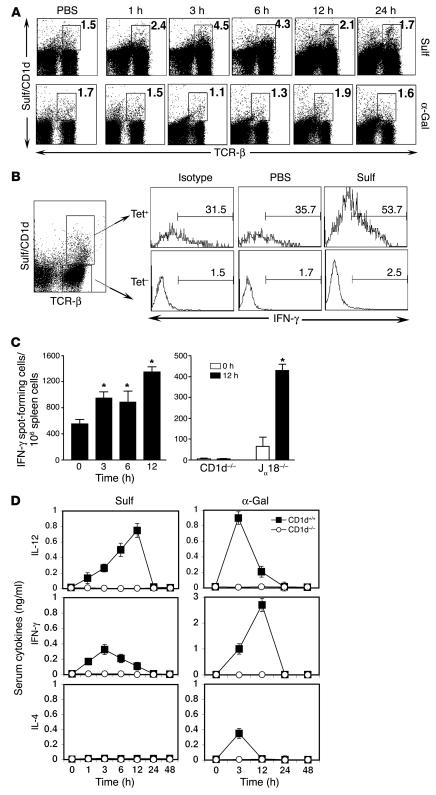
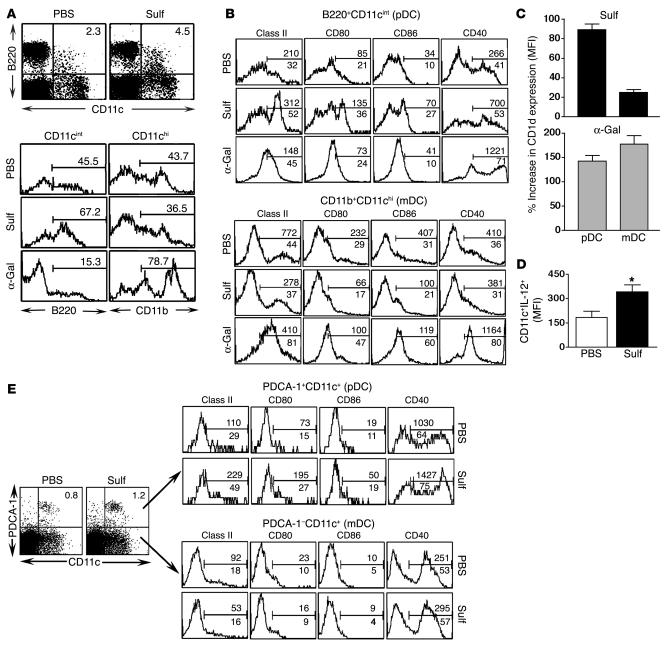
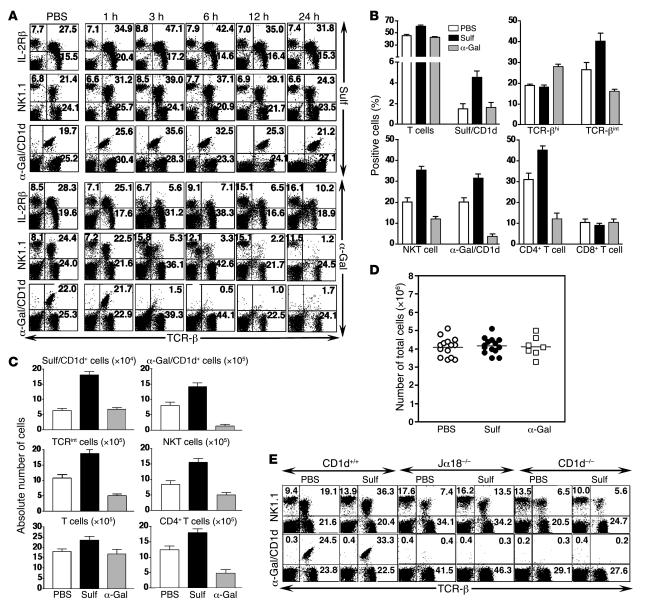
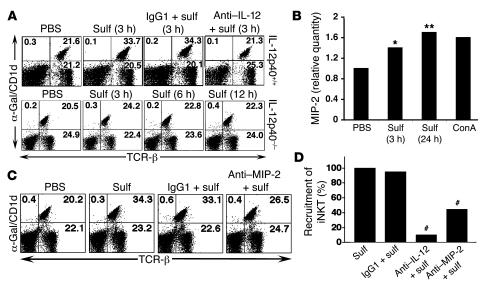
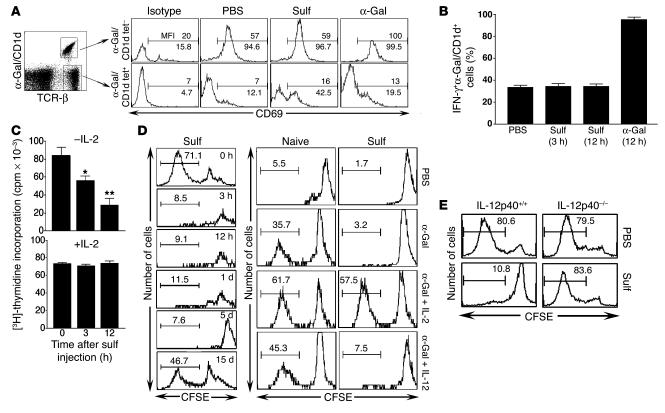
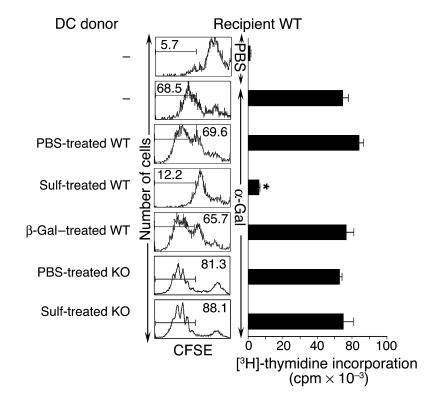
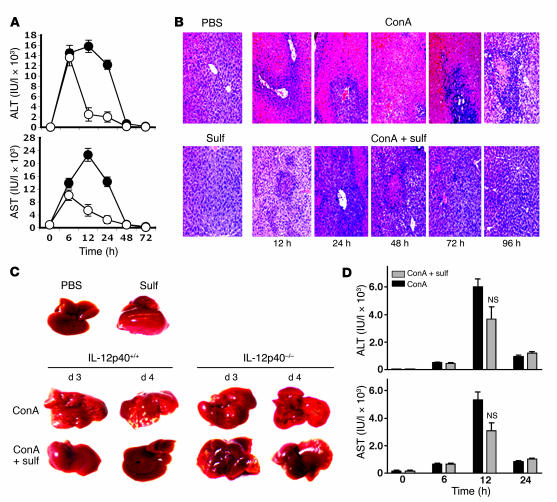
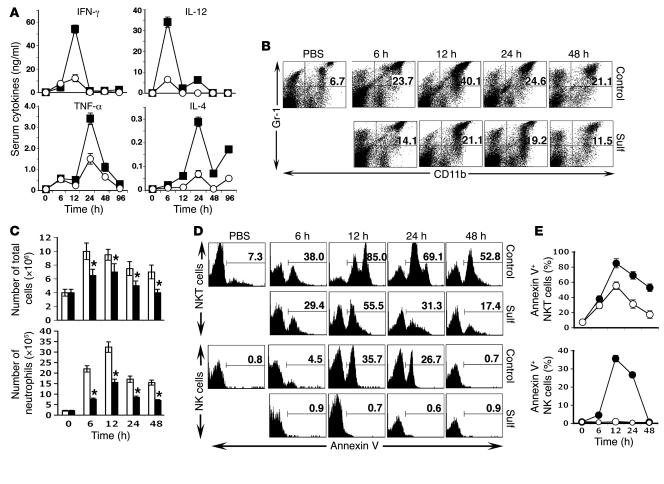
Because of the paucity of known self lipid-reactive ligands for NKT cells, interactions among distinct NKT cell subsets as well as immune consequences following recognition of self glycolipids have not previously been investigated. Here we examined cellular interactions and subsequent immune regulatory mechanism following recognition of sulfatide, a self-glycolipid ligand for a subset of CD1d-restricted type II NKT cells. Using glycolipid/CD1d tetramers and cytokine responses, we showed that activation of sulfatide-reactive type II NKT cells and plasmacytoid DCs caused IL-12- and MIP-2-dependent recruitment of type I, or invariant, NKT (iNKT) cells into mouse livers. These recruited iNKT cells were anergic and prevented concanavalin A-induced (ConA-induced) hepatitis by specifically blocking effector pathways, including the cytokine burst and neutrophil recruitment that follow ConA injection. Hepatic DCs from IL-12(+/+) mice, but not IL-12(-/-) mice, adoptively transferred anergy in recipients; thus, IL-12 secretion by DCs enables them to induce anergy in iNKT cells. Our data reveal what we believe to be a novel mechanism in which interactions among type II NKT cells and hepatic DCs result in regulation of iNKT cell activity that can be exploited for intervention in inflammatory diseases, including autoimmunity and asthma.


Figures

Figure 1
Figure 1. Activation of type II NKT cells and cytokine secretion following sulfatide injection.
(A) Flow cytometric profile of liver MNCs isolated at the indicated times from groups of C57BL/6 mice (n = 2 per group) injected i.p. with 20 μg sulfatide (Sulf), 2 μg α-GalCer (α-Gal), or PBS alone. Two-color staining was performed using sulfatide/CD1d tetramers and anti–TCR-β. Numbers within boxes indicate percent positive cells in total liver lymphocytes. (B) Tri-color flow cytometric analysis of IFN-γ+ cells in liver 3 hours after sulfatide injection. IFN-γ+ cells in sulfatide/CD1d tetramer+ (Tet+) or tetramer cells are shown. Numbers above brackets indicate percent positive cells. (C) ELISPOT analysis of splenocytes isolated at the indicated times from CD1d+/+, CD1d–/–, or Jα18–/– mice following injection with sulfatide or PBS. *P < 0.002. (D) Serum cytokine levels in CD1d+/+ and CD1d–/– mice were examined at the indicated time points following sulfatide or α-GalCer injection. Values are mean ± SD. Data are representative of 3–4 individual experiments.
Figure 2
Figure 2. Selective activation of hepatic pDCs following sulfatide recognition.
(A) Flow cytometric analysis of hepatic pDCs (B220+CD11c+) 3 hours following sulfatide, α-GalCer, or PBS injection. Dot plots are gated on whole MNCs; histogram plots are gated CD11cint and CD11chi populations. Numbers within plots and above brackets indicate percent positive cells. (B) Flow cytometric analysis of costimulatory molecules on hepatic purified CD11c+DCs 12 hours following sulfatide, α-GalCer, or PBS injection. Gated populations were analyzed for anti–I-Ab (class II), anti-CD80 (B7.1), anti-CD86 (B7.2), and anti-CD40. Histogram plots are gated on B220+CD11cint (pDC) or CD11b+CD11chi (mDC) populations. The marker was set up using isotype-matched control Ab. Numbers above brackets indicate MFI; numbers below brackets indicate percent positive cells. (C) Percent change in MFI of CD1d expression on pDCs and mDCs 12 hours following sulfatide or α-GalCer injections in comparison to PBS-injected group. (D) MFI of IL-12 cytokine secreted by hepatic purified CD11c+ DCs 3 hours following sulfatide injection. *P < 0.002. (E) Tri-color flow cytometric analysis of pDCs isolated from sulfatide-injected mice as in B. Liver MNCs were stained with allophycocyanin-conjugated anti–mouse PDCA-1 and PE-conjugated CD11c. Numbers above brackets indicate MFI; numbers below brackets and within plots indicate percent positive cells. Data are representative of 2–3 individual experiments.
Figure 3
Figure 3. Sulfatide-induced CD1d-dependent recruitment of iNKT cells into liver.
(A) Flow cytometric analysis of liver MNCs isolated at the indicated times from groups of C57BL/6 mice (n = 2 per group) injected i.p. with 20 μg sulfatide, 2 μg α-GalCer, or PBS alone. Two-color staining was performed using anti–IL-2Rβ, anti-NK1.1, α-GalCer/CD1d, and anti–TCR-β, and cells were analyzed by flow cytometry. Numbers in quadrants indicate percent positive cells in total liver lymphocytes. (B) Summary of percent positive cells in each group from A and Figure 1A (mean ± SD). (C) Absolute number of various lymphocyte subsets in liver. (D) Total number of liver MNCs 3 hours following sulfatide, α-GalCer, or PBS injection. Horizontal bars indicate mean values of 14 mice in each PBS- and sulfatide-injected group and of 7 mice in α-GalCer–injected group. (E) Flow cytometric analysis of liver MNCs at 3 hours following injection of sulfatide or PBS into CD1d+/+, CD1d–/–, or Jα18–/– mice. Numbers in quadrants indicate percent positive cells. Data are representative of 4–5 individual experiments.
Figure 4
Figure 4. Involvement of IL-12 and MIP-2 in sulfatide-induced recruitment of iNKT cells.
(A) Flow cytometric analysis of liver MNCs isolated at the indicated times from groups of IL-12p40+/+ and IL-12p40–/– mice injected i.p. with 20 μg sulfatide or PBS alone. Groups of IL-12p40+/+ mice also received a neutralizing dose of anti–IL-12 or control IgG1 24 hours before injection with sulfatide. Two-color staining was performed using α-GalCer/CD1d tetramers and anti–TCR-β mAbs. Numbers in quadrants indicate percent positive cells in total liver lymphocytes. (B) Real-time PCR analysis of mRNA isolated from liver tissues at the indicated times after injection in sulfatide- compared with PBS-treated mice. *P < 0.02, **P < 0.009 versus PBS. ConA-stimulated splenocytes were used as a control. (C) Flow cytometric analysis of liver MNCs isolated from groups of C57BL/6 mice injected i.p. with 20 μg sulfatide or PBS alone. Groups of mice also received a neutralizing dose of anti–MIP-2 or control IgG1 24 hours before injection with sulfatide. Analysis was performed as in A. Numbers in quadrants indicate percent positive cells in total liver lymphocytes. (D) Recruitment of iNKT cells into liver following sulfatide injection alone or in combination with anti–IL-12, anti–MIP-2, or isotype-matched IgG1 control antibodies. #P < 0.005 versus sulfatide alone or sulfatide plus IgG1. Data are representative of 3–5 individual experiments.
Figure 5
Figure 5. Anergy induction in the iNKT population.
(A) Tri-color flow cytometric profiles of liver MNCs isolated 3 hours following sulfatide, α-GalCer, or PBS injection. CD69 expression in α-GalCer/CD1d tetramer+ or tetramer populations is shown. Numbers above brackets indicate MFI; numbers below brackets indicate percent positive cells. (B) IFN-γ+α-GalCer/CD1d tetramer+ cells in total liver lymphocytes at the indicated times following sulfatide, α-GalCer, or PBS injection. (C) Incorporation of [3H]-thymidine in triplicate cultures of splenocytes in response to in vitro challenge with α-GalCer (10 ng/ml) in the absence or presence of IL-2 (5 ng/ml). Splenocytes were isolated from mice 3 and 12 hours after sulfatide injection.*P < 0.002, **P < 0.001 versus 0 hours. (D) CFSE dilution profile of α-GalCer/CD1d tetramer+ (iNKT) cells in splenocytes isolated at the indicated time points from sulfatide- or PBS-injected mice. Splenocytes were labeled with CFSE and stimulated with α-GalCer in vitro in the presence or absence of IL-2. IL-12 served as a control. (E) CFSE dilution analysis of hepatic α-GalCer/CD1d tetramer+ cells in response to in vitro stimulation with α-GalCer from IL-12p40+/+ and IL-12p40–/– mice injected with sulfatide or PBS. Numbers above brackets in D and E indicate percent positive cells. Data are representative of 3–4 individual experiments.
Figure 6
Figure 6. Adoptive transfer of hepatic DCs from sulfatide-treated IL-12p40+/+ mice, but not from IL-12p40–/– mice, induces anergy in iNKT cells in recipients.
Shown are CFSE dilution and [3H]-thymidine incorporation of splenocytes in response to in vitro challenge with α-GalCer in recipient WT (IL-12p40+/+) mice. Groups of WT or KO (IL-12p40–/–) mice (n = 10 per group) were injected with sulfatide, β-GalCer, or PBS. One day later, purified liver CD11c+ DCs (4–5 × 10⁵) from donor mice were injected i.v. into WT recipients. Two days later, splenocytes were assayed for in vitro proliferation to α-GalCer, and analysis was performed as in Figure 5, C and D. Numbers above brackets indicate percent positive cells. *P < 0.001 in sulfatide-treated WT groups versus PBS-treated WT, β-GalCer–treated WT, and sulfatide-treated IL-12 KO groups. Data are representative of 2–3 individual experiments.
Figure 7
Figure 7. Sulfatide administration protects against ConA-induced hepatitis.
(A) ALT and AST levels were examined in serum at different time points in IL-12p40+/+ mice injected with ConA (filled symbols) or ConA plus sulfatide (open symbols). Values are mean ± SD of 5 mice per group. P < 0.001 between groups. (B) Representative H&E-stained liver sections of mice treated with ConA and ConA plus sulfatide. The bottom left image is from a control mouse injected with sulfatide only. Original magnification, ×200. (C) Gross morphology of liver of ConA- and sulfatide-treated IL-12p40+/+ and IL-12p40–/– mice. Top panel shows control mice injected with PBS or sulfatide only. (D) ALT and AST levels in IL-12p40–/– mice injected with ConA or ConA plus sulfatide. No significant difference between the 2 groups (P ≥ 0.75) was observed at the 12-hour time point. Data are representative of 3–4 individual experiments.
Figure 8
Figure 8. Prevention of ConA-induced hepatitis is associated with inhibition of serum cytokine burst, neutrophil recruitment, and apoptosis of NKT cells.
(A) Serum cytokine levels in mice treated with ConA control (filled squares) and sulfatide (open circles) were examined at various time points by ELISA. Values are mean ± SD of 6 mice per group. P < 0.002 between groups. (B) FACS profile of Gr-1+CD11b+ cells in the liver of sulfatide-treated or untreated control mice. Numbers within dot plots indicate percent positive cells. (C) Liver leukocytes were isolated at the indicated time points from groups of mice injected with ConA (white bars) or ConA plus sulfatide (black bars), and the total number of live cells was counted. Values are mean ± SD of 6 mice per group. *P < 0.004 versus ConA alone. (D) Representative FACS profile showing annexin V+ NKT and NK cells in the livers of sulfatide-treated and control mice. Numbers above brackets indicate percent positive cells. (E) Summary of annexin V+ NKT and NK cells as in D from control (filled circles) or sulfatide-treated (open circles) mice. P < 0.003 between groups. Data are mean ± SD of 3 mice per group and are representative of 2–3 individual experiments.

References

    1. Crispe I.N. Hepatic T cells and liver tolerance. Nat. Rev. Immunol. 2003;3:51–62. - PubMed
    1. Calne R.Y., et al. Toleragenic effects of porcine liver allografts. Br. J. Surg. 1969;56:692–693. - PubMed
    1. Lueth S., Lohse A.W. Autoimmune hepatitis. Clin. Med. 2006;6:25–28. - PMC - PubMed
    1. Herkel J., Schuchmann M., Tiegs G., Lohse A.W. Immune-mediated liver injury. J. Hepatol. 2005;42:920–923. - PubMed
    1. Tiegs G., Hentschel J., Wendel A. A T cell-dependent experimental liver injury in mice inducible by concanavalin A. J. Clin. Invest. 1992;90:196–203. - PMC - PubMed

Publication types

MeSH terms