. 2007 Oct;152(3):313-22.
doi: 10.1038/sj.bjp.0707398. Epub 2007 Jul 23.

The peptidase inhibitor CGS-26303 increases endothelin converting enzyme-1 expression in endothelial cells through accumulation of big endothelin-1

Affiliations

The peptidase inhibitor CGS-26303 increases endothelin converting enzyme-1 expression in endothelial cells through accumulation of big endothelin-1

V Raoch et al. Br J Pharmacol. 2007 Oct.

Abstract

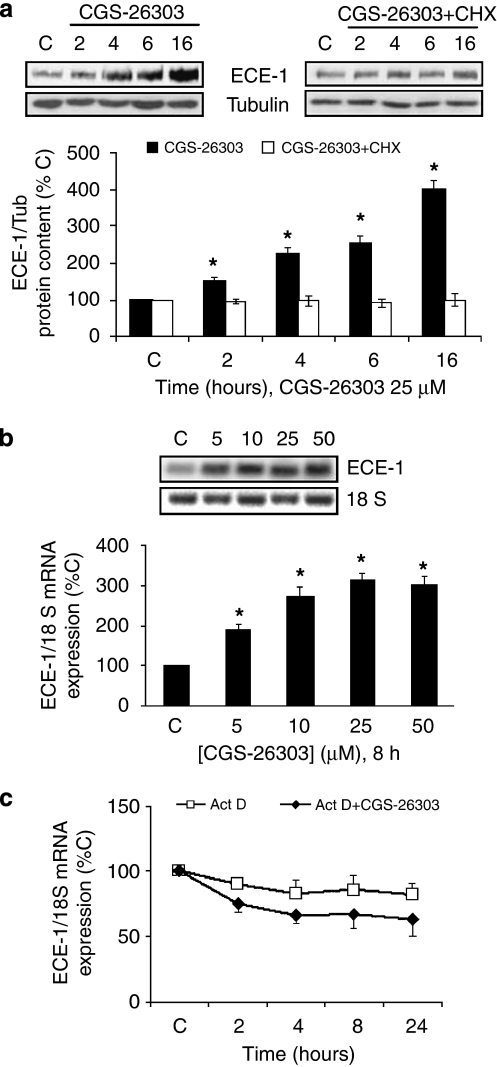
Background and purpose: CGS-26303 inhibits endothelin converting enzyme (ECE)-1 more specifically than phosphoramidon. We have studied the effect of CGS-26303 on ECE-1 expression in bovine aortic endothelial cells.

Methods: ECE-1 activity and big endothelin (ET)-1 levels were measured by ELISA, ECE-1 expression using western and northern blot and promoter activity using transfection assays.

Key results: ECE-1 activity was completely inhibited by CGS-26303 25 microM and phosphoramidon 100 microM. CGS-26303 and phosphoramidon, though not thiorphan, a neutral endopeptidase (NEP) inhibitor, stimulated ECE-1 expression in cells (maximal effect at 16 h, 25 microM). Cycloheximide abolished that effect. CGS-26303 induced ECE-1 mRNA expression and ECE-1 promoter activity. CGS-35066, a selective ECE-1 inhibitor, mimicked the effects of CGS-26303, suggesting that the effect was specific to ECE-1 inhibition. Big ET-1 accumulated in the cells and in the supernatants after CGS-26303 treatment. Neither exogenously added ET-1 nor the blockade of their receptors with bosentan modified ECE-1 protein. When big ET-1 was added to cells, significant increases in ECE-1 protein content and ECE-1 promoter activity were found. Bosentan did not block those effects. CGS-26303 did not modify prepro-ET-1 expression. CGS-26303 and big ET-1 induced the same effects in human endothelial cells, at lower doses.

Conclusions: These results suggest that the accumulation of big ET-1 is responsible for the effects of CGS-26303 on ECE-1 and they did not depend on NEP blockade. Changes in ECE-1 protein after the administration of CGS-26303 could lead to a decreased response in long-term treatments.


Figures

Figure 1
Figure 1
Effects of CGS-26303 on ECE-1 activity and ECE-1 protein content. (a) Cell extracts from BAEC were incubated with different concentrations of CGS-26303 for 6 h and ECE-1 activity was measured. 100 μM phosphoramidon (PP) was used as an internal control. Results are the mean value±s.e. mean of four independent experiments. *P<0.05 vs control values (C). (b) BAEC were incubated for 16 h with 25 μM CGS-26303, 100 μM PP, and 10 μM thiorphan (TP). A representative western blot is shown in the upper part of the panel, whereas in the lower part, the densitometric analysis of three independent experiments is shown (mean value±s.e. mean). *P<0.05 vs control values (C). BAEC, bovine aortic endothelial cells; ECE-1, endothelin converting enzyme-1; PP, phosphoramidon; TP, thiorphan.
Figure 2
Figure 2
Effect of CGS-26303 on ECE-1 protein content. BAEC were incubated for different periods of time with 25 μM CGS-26303 (a), or with different concentrations of CGS-26303 for 16 h (b). A representative western blot is shown in the upper part of each panel, whereas in the lower part, the densitometric analysis of five independent experiments is shown (mean value±s.e. mean). *P<0.05 vs control values (C). BAEC, bovine aortic endothelial cells; ECE-1, endothelin converting enzyme-1.
Figure 3
Figure 3
Mechanisms involved in the CGS-26303-dependent upregulation of ECE-1. Importance of protein synthesis, mRNA expression and mRNA stability. (a) BAEC were incubated with 25 μM CGS-26303 for different periods of time in basal conditions or in the presence of 1 μM cycloheximide (CHX). A representative western blot is shown above the densitometric analysis of three independent experiments (mean value±s.e. mean). *P<0.05 vs control cells (C). (b) BAEC were incubated with different concentrations of CGS-26303 for 8 h. A representative northern blot is shown in the upper part of the panel, whereas in the lower part, the densitometric analysis of three independent experiments is shown (mean value±s.e. mean). *P<0.05 vs control cells (C). (c) BAEC were incubated with actinomycin D (Act D) (10 μg ml−1) with and without 25 μM CGS-26303, at different times. The mean values of mRNA levels in three independent experiments are shown (mean value±s.e. mean). Act D alone; Act D+CGS-26303. Act D, actinomycin D; BAEC, bovine aortic endothelial cells; CHX, cycloheximide; ECE-1, endothelin converting enzyme-1.
Figure 4
Figure 4
Mechanism involved in the CGS-26303-dependent upregulation of ECE-1. Importance of ECE-1 promoter activation. BAEC were incubated for different periods of time with 25 μM CGS-26303 (a), or with different concentrations of CGS-26303 for 6 h (b). Results are the mean value±s.e. mean of four independent experiments. *P<0.05 vs control values (C). The stimulation observed with phorbol myristate acetate (PMA; 0.3 μM) for 6 h, which was used as a positive control, was 283±38% (n=4). BAEC, bovine aortic endothelial cells; ECE-1, endothelin converting enzyme-1; PMA, phorbol myristate acetate.
Figure 5
Figure 5
Effects of CGS-35066 on ECE-1 protein content and ECE-1 promoter activity. (a, b) BAEC were incubated for different periods of time with 5 μM CGS-35066 (a), or with different concentrations of CGS-35066 for 16 h (b). A representative western blot is shown in the upper part of each panel, whereas in the lower part the densitometric analysis of five independent experiments is shown (mean value±s.e. mean). *P<0.05 vs control values (C). (c) BAEC were incubated with two doses of CGS-35066 and with 25 μM of CGS-26303 for 6 h. Results are the mean value±s.e. mean of three independent experiments. *P<0.05 vs control values (C). The stimulation observed with PMA (0.3 μM) for 6 h, which was used as a positive control, was 349±42% (n=3). BAEC, bovine aortic endothelial cells; ECE-1, endothelin converting enzyme-1; PMA, phorbol myristate acetate.
Figure 6
Figure 6
Effect of CGS-26303 on big ET-1 levels in cells and supernatants. (a) BAEC were incubated for 16 h with 25 μM CGS-26303, 100 μM phosphoramidon (PP) or 10 μM thiorphan (TP), and big ET-1 was measured in cell supernatants. Results are the mean value±s.e. mean of five independent experiments. *P<0.05 vs control values (C). Big ET-1 concentration was 29±3 fmol ml−1 in control cells. (b) BAEC were incubated for 16 h with 25 μM CGS-26303 and 25 nM big ET-1, and intracellular big ET-1 was measured in cells. *P<0.05 vs control values (C). Intracellular big ET-1 concentration was 25±4 fmol ml−1 mg−1 protein in control cells. BAEC, bovine aortic endothelial cells; ECE-1, endothelin converting enzyme-1; ET-1, endothelin-1; PP, phosphoramidon; TP, thiorphan.
Figure 7
Figure 7
Role of ET-1, ET-1 (1–31) and big ET-1 in the CGS-26303-dependent ECE-1 upregulation. (a) BAEC were incubated for different periods of time with 10 nM ET-1 alone, or with 10 nM ET-1, in the absence or presence of 10 μM bosentan for 16 h. A representative western blot is shown in the upper part of the panel, whereas the densitometric analysis of four independent experiments is shown below (mean value±s.e. mean). (b) BAEC were incubated for different periods of time with 10 nM ET-1 (1–31) alone or with 10 nM ET-1 (1–31) for 16 h, in the absence or presence of 10 μM bosentan. A representative western blot is shown in the upper part of the panel, whereas the densitometric analysis of three independent experiments is shown below (mean value±s.e. mean). (C) BAEC were incubated for 16 h in control conditions (C), or with 25 nM big ET-1 or 25 μM CGS-26303 in the absence or presence of 10 μM bosentan. A representative western blot is shown above, whereas in the lower part the densitometric analysis of four independent experiments is shown (mean value±s.e. mean). *P<0.05 vs control values (c). BAEC, bovine aortic endothelial cells; ECE-1, endothelin converting enzyme-1; ET-1, endothelin-1.
Figure 8
Figure 8
Effect of big ET-1 on ECE-1 protein content. BAEC were incubated for different periods of time with 25 nM big ET-1 (a) or with different doses of big ET-1 for 16 h (b). A representative western blot is shown in the upper part of each panel, whereas in the lower part the densitometric analysis of four independent experiments is shown (mean value±s.e. mean). *P<0.05 vs control values (C). BAEC, bovine aortic endothelial cells; ECE-1, endothelin converting enzyme-1; ET-1, endothelin-1.
Figure 9
Figure 9
Effect of big ET-1 on ECE-1 promoter activity. BAEC were incubated for different periods of time with 25 nM big ET-1 (a) or with different doses of big ET-1 for 6 h (b). Results are the mean value±s.e. mean of four independent experiments. *P<0.05 vs control values (C). The stimulation observed with PMA (0.3 μM) for 6 h, which was used as a positive control, was 272±25% (n=4). BAEC, bovine aortic endothelial cells; ECE-1, endothelin converting enzyme-1; ET-1, endothelin-1; PMA, phorbol myristate acetate.
Figure 10
Figure 10
Effect of CGS-26303 on prepro-ET-1 (ppET-1) mRNA expression. BAEC were incubated for different periods of time with 25 μM CGS-26303 (a) or with different concentrations of CGS-26303 for 16 h (b). A representative northern blot is shown in the upper part of each panel, whereas in the lower part the densitometric analysis of four independent experiments is shown (mean value±s.e. mean). BAEC, bovine aortic endothelial cells; ppET-1, prepro-ET-1.
Figure 11
Figure 11
Effects of CGS-26303, big ET-1 and CGS-35066 on ECE-1 protein content in human endothelial cells (EA.hy926). (a) EA.hy926 were incubated with different compounds, 25 nM big ET-1, 25 μM CGS-26303 and 5 μM CGS-35066 for 16 h. (b) EA.hy926 were incubated with different doses of CGS-26303 for 16 h. A representative western blot is shown in the upper part of each panel, whereas in the lower part the densitometric analysis of four independent experiments is shown (mean value±s.e. mean). *P<0.05 vs control values (C). ECE-1, endothelin converting enzyme-1; ET-1, endothelin-1.

Similar articles

Cited by

References

    1. Aharinejad S, Krenn K, Paulus P, Schafer R, Zuckermann A, Grimm M, et al. Differential role of TGF-beta1/bFGF and ET-1 in graft fibrosis in heart failure patients. Am J Transplant. 2005;5:2185–2192. - PubMed
    1. Attina T, Camidge R, Newby DE, Webb DJ. Endothelin antagonism in pulmonary hypertension, heart failure, and beyond. Heart. 2005;91:825–831. - PMC - PubMed
    1. Chomczynski P, Sacchi N. Single-step method of RNA isolation by acid guanidinium thiocyanate–phenol chloroform extraction. Anal Biochem. 1987;162:156–159. - PubMed
    1. Emoto N, Yanagisawa M. Endothelin-converting enzyme-2 is a membrane-bound, phosphoramidon-sensitive metalloprotease with acidic pH optimum. J Biol Chem. 1995;270:15262–15268. - PubMed
    1. Eto M, Barandier C, Rathgeb L, Kozai T, Joch H, Yang Z, et al. Thrombin suppresses endothelial nitric oxide synthase and upregulates endothelin-converting enzyme-1 expression by distinct pathways: role of Rho/ROCK and mitogen-activated protein kinase. Circ Res. 2001;89:583–590. - PubMed

Publication types

MeSH terms