Influence of substratum surface chemistry/energy and topography on the human fetal osteoblastic cell line hFOB 1.19: Phenotypic and genotypic responses observed in vitro
- PMID: 17644175
- PMCID: PMC2705827
- DOI: 10.1016/j.biomaterials.2007.06.016
Influence of substratum surface chemistry/energy and topography on the human fetal osteoblastic cell line hFOB 1.19: Phenotypic and genotypic responses observed in vitro
Abstract
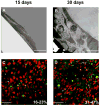
Time-dependent phenotypic response of a model osteoblast cell line (hFOB 1.19, ATCC, and CRL-11372) to substrata with varying surface chemistry and topography is reviewed within the context of extant cell-adhesion theory. Cell-attachment and proliferation kinetics are compared using morphology as a leading indicator of cell phenotype. Expression of (alpha2, alpha3, alpha4, alpha5, alphav, beta1, and beta3) integrins, vinculin, as well as secretion of osteopontin (OP) and type I collagen (Col I) supplement this visual assessment of hFOB growth. It is concluded that significant cell-adhesion events-contact, attachment, spreading, and proliferation-are similar on all surfaces, independent of substratum surface chemistry/energy. However, this sequence of events is significantly delayed and attenuated on hydrophobic (poorly water-wettable) surfaces exhibiting characteristically low-attachment efficiency and long induction periods before cells engage in an exponential-growth phase. Results suggest that a 'time-cell-substratum-compatibility-superposition principle' is at work wherein similar bioadhesive outcomes can be ultimately achieved on all surface types with varying hydrophilicity, but the time required to arrive at this outcome increases with decreasing cell-substratum-compatibility. Genomic and proteomic tools offer unprecedented opportunity to directly measure changes in the cellular machinery that lead to observed cell responses to different materials. But for the purpose of measuring structure-property relationships that can guide biomaterial development, genomic/proteomic tools should be applied early in the adhesion/spreading process before cells have an opportunity to significantly remodel the cell-substratum interface, effectively erasing cause and effect relationships between cell-substratum-compatibility and substratum properties. IMPACT STATEMENT: This review quantifies relationships among cell phenotype, substratum surface chemistry/energy, topography, and cell-substratum contact time for the model osteoblast cell line hFOB 1.19, revealing that genomic/proteomic tools are most useful in the pursuit of understanding cell adhesion if applied early in the adhesion/spreading process.
Figures


Similar articles
-
Integrin expression and osteopontin regulation in human fetal osteoblastic cells mediated by substratum surface characteristics.Tissue Eng. 2005 Jan-Feb;11(1-2):19-29. doi: 10.1089/ten.2005.11.19. Tissue Eng. 2005. PMID: 15738658
-
Systematic variation in osteoblast adhesion and phenotype with substratum surface characteristics.J Biomed Mater Res A. 2004 Mar 1;68(3):504-12. doi: 10.1002/jbm.a.20087. J Biomed Mater Res A. 2004. PMID: 14762930
-
The regulation of integrin-mediated osteoblast focal adhesion and focal adhesion kinase expression by nanoscale topography.Biomaterials. 2007 Apr;28(10):1787-97. doi: 10.1016/j.biomaterials.2006.12.020. Epub 2006 Dec 21. Biomaterials. 2007. PMID: 17218005
-
[Advance in research of osteoblast adhesion to bioactive materials].Sheng Wu Yi Xue Gong Cheng Xue Za Zhi. 2005 Aug;22(4):848-52. Sheng Wu Yi Xue Gong Cheng Xue Za Zhi. 2005. PMID: 16156288 Review. Chinese.
-
[Effects of nanotopography for biomaterials on cell behaviors].Sheng Wu Yi Xue Gong Cheng Xue Za Zhi. 2007 Jun;24(3):685-9. Sheng Wu Yi Xue Gong Cheng Xue Za Zhi. 2007. PMID: 17713289 Review. Chinese.
Cited by
-
Primary human nasal epithelial cell response to titanium surface with a nanonetwork structure in nasal implant applications.Nanoscale Res Lett. 2015 Apr 8;10:167. doi: 10.1186/s11671-015-0849-8. eCollection 2015. Nanoscale Res Lett. 2015. PMID: 25977647 Free PMC article.
-
Enhanced Tribological and Bacterial Resistance of Carbon Nanotube with Ceria- and Silver-Incorporated Hydroxyapatite Biocoating.Nanomaterials (Basel). 2018 May 24;8(6):363. doi: 10.3390/nano8060363. Nanomaterials (Basel). 2018. PMID: 29794997 Free PMC article.
-
Peripheral nerve regeneration using a bioresorbable silk fibroin-based artificial nerve conduit fabricated via a novel freeze-thaw process.Sci Rep. 2025 Jan 30;15(1):3797. doi: 10.1038/s41598-025-88221-y. Sci Rep. 2025. PMID: 39885362 Free PMC article.
-
Bone Morphogenetic Protein 2 Alters Osteogenesis and Anti-Inflammatory Profiles of Mesenchymal Stem Cells Induced by Microtextured Titanium In Vitro<sup/>Tissue Eng Part A. 2017 Oct;23(19-20):1132-1141. doi: 10.1089/ten.TEA.2017.0003. Epub 2017 May 19. Tissue Eng Part A. 2017. PMID: 28351289 Free PMC article.
-
Biomimetic three-dimensional nanocrystalline hydroxyapatite and magnetically synthesized single-walled carbon nanotube chitosan nanocomposite for bone regeneration.Int J Nanomedicine. 2012;7:2087-99. doi: 10.2147/IJN.S29743. Epub 2012 Apr 24. Int J Nanomedicine. 2012. PMID: 22619545 Free PMC article.
References
-
- Baxter LC, Frauchiger V, Textor M, Gwynn Ia, Richards RG. Fibroblast and osteoblast adhesion and morphology on calcium phosphate surfaces. European Cells and Materials. 2002;4:1–17. - PubMed
-
- Grinnell F. Cellular Adhesiveness and Extracellular Substrata. In: Bourne GH, Danielli JF, Jeon KW, editors. International Review of Cytology. New York: Academic Press; 1978. pp. 67–145. - PubMed
-
- Altankov G, Grinnell F, Groth T. Studies on the Biocompatibility of Materials: Fibroblast Reorganization of Substratum-bound Fibronectin on Surfaces Varying in Wettability. J Biomed Mat Res. 1996;30:385–91. - PubMed
-
- Pethica BA. The physical chemistry of cell adhesion. Experimental Cell Research Supplement. 1961;(8):123–40. - PubMed
-
- Rutter PR. The Physical Chemistry of the Adhesion of Bacteria and Other Cells. In: Curtis ASG, Pitts JD, editors. Cell Adhesion and Motility. London: Cambridge University Press; 1980. pp. 103–35.
Publication types
MeSH terms
Substances
Grants and funding
LinkOut - more resources
Full Text Sources
Research Materials
Miscellaneous

