. 2007 Jul;19(7):2140-55.
doi: 10.1105/tpc.106.043729. Epub 2007 Jul 20.

Molecular interactions of a soluble gibberellin receptor, GID1, with a rice DELLA protein, SLR1, and gibberellin

Affiliations

Molecular interactions of a soluble gibberellin receptor, GID1, with a rice DELLA protein, SLR1, and gibberellin

Miyako Ueguchi-Tanaka et al. Plant Cell. 2007 Jul.

Abstract

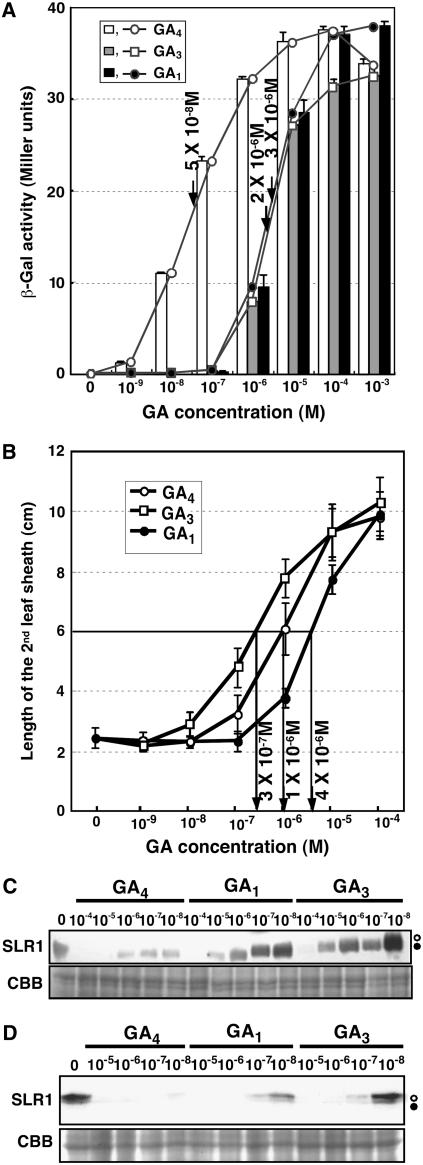
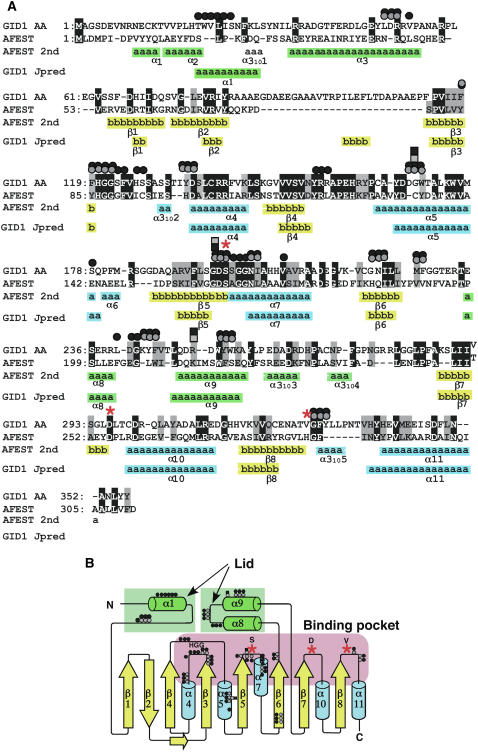
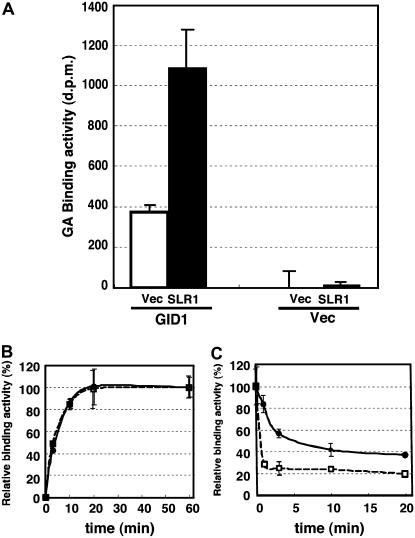
GIBBERELLIN INSENSITIVE DWARF1 (GID1) encodes a soluble gibberellin (GA) receptor that shares sequence similarity with a hormone-sensitive lipase (HSL). Previously, a yeast two-hybrid (Y2H) assay revealed that the GID1-GA complex directly interacts with SLENDER RICE1 (SLR1), a DELLA repressor protein in GA signaling. Here, we demonstrated, by pull-down and bimolecular fluorescence complementation (BiFC) experiments, that the GA-dependent GID1-SLR1 interaction also occurs in planta. GA(4) was found to have the highest affinity to GID1 in Y2H assays and is the most effective form of GA in planta. Domain analyses of SLR1 using Y2H, gel filtration, and BiFC methods revealed that the DELLA and TVHYNP domains of SLR1 are required for the GID1-SLR1 interaction. To identify the important regions of GID1 for GA and SLR1 interactions, we used many different mutant versions of GID1, such as the spontaneous mutant GID1s, N- and C-terminal truncated GID1s, and mutagenized GID1 proteins with conserved amino acids replaced with Ala. The amino acid residues important for SLR1 interaction completely overlapped the residues required for GA binding that were scattered throughout the GID1 molecule. When we plotted these residues on the GID1 structure predicted by analogy with HSL tertiary structure, many residues were located at regions corresponding to the substrate binding pocket and lid. Furthermore, the GA-GID1 interaction was stabilized by SLR1. Based on these observations, we proposed a molecular model for interaction between GA, GID1, and SLR1.


Figures

Figure 1.
Figure 1.
GA-Dependent Interaction between GID1 and SLR1 in Vivo. (A) SLR1 was coimmunoprecipitated with GFP-GID1 in a GA-dependent manner by the GFP antibody. Each protein extract was prepared from two independent lines of transgenic rice callus overproducing GFP-GID1 (line 1 and line 2) treated with (+) or without (−) 10−5 M GA4 for 5 min. Immunoblot analysis of the extract and α-GFP immunoprecipitates was performed using anti-GFP or anti-SLR1 antibody. Closed circles, nonphosphorylated SLR1; open circles, phosphorylated SLR1. (B) BiFC analysis of in vivo interaction between GID1 and SLR1 in N. benthamiana leaf epidermis (Abe et al., 2005). BF, blight-field image; EYFP, EYFP fluorescence; DAPI, 4′,6-diamidino-2-phenylindole; merge, merge of EYFP and DAPI images; NY-GID1, expression of N·EYFP-GID1 alone; CY-SLR1, expression of C·EYFP-SLR1 alone; NY-GID1 and CY-SLR1, coexpression of N·EYFP-GID1 and C·EYFP-SLR1; NY-GID1 and CY-ΔDELLA, coexpression of N·EYFP-GID1 and C·EYFP-ΔDELLA·SLR1; NYGID1 and CY-ΔTVHYNP, coexpression of N·EYFP-GID1 and C·EYFP-ΔTVHYNP·SLR1. Leaves were sprayed with (+) or without (−) 10−4 M GA4 10 min before observation of the signals. Bar = 10 μm.
Figure 2.
Figure 2.
The Effect of Various GAs on GID1–SLR1 Interaction in Yeast Cells or on Second Leaf Sheath Elongation. (A) Y2H assay using GID1 as bait and SLR1 as prey in the presence of 10−5 M various GAs. β-Gal activity was determined by a liquid assay with yeast strain Y187 transformants (means ± sd; n = 3). H2-GA4, 16,17-dihydro-GA4; GA4-Me, GA4 methyl ester; BL, blank. (B) Dose dependency of second leaf sheath elongation to various GAs in seedlings of a GA-deficient rice mutant, Tan-Ginbozu, by one-drop treatment (see Methods). The line colors correspond to those in (A). Data are means ± sd; n = 10.
Figure 3.
Figure 3.
The Dose Dependency of GA1, GA3, and GA4 for GID1–SLR1 Interaction in Y2H and for in Vivo GA Responses in Rice Cells. (A) Y2H assay using GID1 as bait and SLR1 as prey in the presence of various concentrations of GA1, GA3, or GA4. β-Gal activity was determined as in Figure 2A. Data are means ± sd, n = 3. The 50% saturation points are indicated by arrows. (B) Second leaf sheath elongation in seedlings of a GA-deficient rice mutant, Tan-Ginbozu, treated with various concentrations of GA1, GA3, or GA4. Data are means ± sd, n = 10. The 50% saturation points are indicated by arrows. (C) and (D) Degradation of SLR1 protein in rice cells treated with various concentrations of GA1, GA3, or GA4. The seedling of Tan-Ginbozu (C) and the wild callus (D) were treated with GAs for 2 h and 5 min, respectively. Immunoblot analyses were performed using anti-SLR1 antibody. Closed circles, nonphosphorylated SLR1; open circles, phosphorylated SLR1.
Figure 4.
Figure 4.
DELLA and TVHYNP Domains Are Essential for Interaction between GID1 and SLR1 in the Y2H Assay. (A) Diagrams showing the SLR1 deletion constructs tested in the Y2H assay. (B) Y2H assay using full-length GID1s as baits and the SLR1s deletion mutants as prey with or without 10−4 M GA3. Right, β-Gal activity detected in a liquid assay with yeast strain Y187 transformants (means ± sd; n = 3). Left, Growth of yeast strain AH109 transformants on −His plates with or without 10−4 M GA3.
Figure 5.
Figure 5.
In Vitro Interaction between GID1 and SLR1 via DELLA and TVHYNP Domains. (A) Left: elution profiles of Trx·His-GID1, Trx·His-SLR1(M1-A172), the mixture of Trx·His-GID1 and Trx·His-SLR1(M1-A172) in the absence or presence of 10−4 M GA3, and detagged SLR1 (M1-A172) by Superdex-200 gel filtration. Trx·His-GID1 was eluted as a monomer, while SLR1 (M1-A172) with or without the tag was eluted at much larger MW fractions. The MW of the peak fractions was estimated from the following molecular markers (M.M.): 25-kD chymotrypsinogen A, 43-kD ovalbumin, 67-kD albumin, and 134-kD albumin dimer, which are indicated by arrowheads at the top. Dashed lines indicate the peak positions of Trx·His-SLR1 (M1-A172) (∼85 kD) and Trx·His-GID1 (∼65 kD). Peaks 1 and 2 indicate overlapping peaks of the mixture of Trx·His-GID1 and Trx·His-SLR1 (M1-A172) in the absence of GA3. The asterisk indicates a new peak of the same mixture in the presence of GA3 with disappearance of peaks 1 and 2. Each peak fraction was subjected to SDS-PAGE. Right: SDS-PAGE of each peak fraction. (B) Left: elution profiles of various kinds of mutant Trx·His-SLR1s and their mixtures incubated with Trx·His-GID1 in the presence of 10−4 M GA3 by Superdex-200 gel filtration. The tightly dashed line indicates the peak position of Trx·His-GID1 (tagged GID1; ∼63 kD). The roughly dashed lines indicate the peak position of each Trx·His-SLR1 mutant protein. Peaks shifted by incubation with GID1 and GA3 are indicated by asterisks, and peaks not shifted by incubation are indicated by open arrowheads. These peaks were subjected to SDS-PAGE. Right: SDS-PAGE of each peak fraction. The molecular marker for gel filtration and SDS-PAGE are the same as in (A).
Figure 6.
Figure 6.
Eight gid1 Mutant Alleles and GA Binding and SLR1-Interacting Activities of Mutated GID1 Proteins. (A) A schematic structure of GID1 represents the mutation positions of eight gid1 alleles and the positions of N-terminal (ΔN1, ΔN2, and ΔN3) and C-terminal (ΔC) deletions. Amino acid residues shared with HSL, such as HGG and GXSXG, are presented within red boxes. The residues corresponding to the catalytic triad of HSL, S, D, and V, are also presented by filled circles. (B) Gross morphology of eight gid1 mutant alleles grown for 2 weeks. A wild-type plant is shown as a control. Bar = 5 cm. (C) Top: GA binding activities of Trx·His-GID1 (wild type) and the corresponding mutated gid1 alleles. Data are means ± sd; n = 3. Bottom: Coomassie blue control. Approximately equal amounts of proteins (∼3.2 μg) were used. (D) Y2H assay using full-length GID1 and the corresponding mutated gid1 alleles as baits and the full-length SLR1 as prey in the presence (+) and absence (−) of 10−4 M GA3. The Y2H assay was performed the same as in Figure 4B. Top: β-Gal activity (means ± sd; n = 3). Bottom: growth of yeast on −His plates. (E) Top: GA binding activities of Trx·His-GID1 and mutated Trx·His-GID1s with deletions in the N-terminal (ΔN1, ΔN2, and ΔN3) or C-terminal (ΔC) regions. Data are means ± sd; n = 3. Bottom: Coomassie blue control. Approximately equal amounts of proteins (∼3.2 μg) were used. (F) Y2H assay using full-length GID1 and mutated GID1s with deletions in the N-terminal (ΔN1, ΔN2, and ΔN3) or C-terminal (ΔC) regions as baits and the full-length SLR1 as prey in the presence (+) and absence (−) of 10−4 M GA3. The Y2H assay was performed the same as in Figure 4B. Top: β-Gal activity (means ± sd; n = 3). Bottom: growth of yeast on −His plates.
Figure 7.
Figure 7.
Ala Scanning Analysis of GID1 for Its GA Binding and SLR1-Interacting Activities. (A) Specific GA binding activity of 94 mutated Trx·His-GID1s and wild-type Trx·His-GID1 (at the left). Mutated residues are indicated at the top of each bar. Specific activity was calculated as radioactivity (dpm) per microgram of protein. Data are means ± sd; n = 3. Hatched boxes indicate the mutant proteins showing no GA binding activity. The mutated proteins showing increased activity that are discussed in the text are boxed. (B) SLR-interacting activity of 94 mutated GID1s and the wild-type GID1 (at the left). Y2H assay using 94 mutated and wild-type GID1s as baits and the full-length SLR1 as prey in the presence of 10−4 M GA3. Each mutation of GID1 corresponds to (A). Dotted boxes indicate the mutant proteins showing no β-Gal activity. Thick and narrow arrows indicate mutant proteins having GA binding activity but not SLR1-interacting activity, whose mutation points are adjacent to the hatched box (thick) or independently located (narrow). The mutated proteins having increased SLR1-interacting activity that are discussed in the text are indicated by arrowheads. HGG and GDSSG correspond to the substrate binding pocket of HSL, and D corresponds to one of the residues in the catalytic triad in HSL.
Figure 8.
Figure 8.
Prediction of the GID1 Secondary Structure, Location of Important Residues for GA Binding, and SLR1 Interaction Activity on the Predicted Structure. (A) The alignment of GID1 and a member of HSL, AFEST, whose special conformation was analyzed by x-ray crystallography. The line of AFEST 2nd shows the secondary structure of AFEST analyzed by x-ray crystallography (De Simone et al., 2001). The predicted second structure of GID1 (GID1 Jpred) was calculated by a Jpred program (Cuff et al., 1998). α-helices and β-sheets are represented by a and b, respectively. Number of α-helices and β-sheets of the predicted GID1 was according to that of AFEST 2nd. Essential residues for GA binding (gray) and SLR1 interaction (black) were determined by an Ala scanning experiment (dot) or spontaneous mutants, gid1-1 (G196→D), gid1-2 (R251→T), and gid1-5 (G169→E) (square). Three amino acid residues corresponding to the catalytic triad of HSL are represented as asterisks. (B) A topology diagram of GID1 written by the predicted second structure in (A). Symbols are the same as in (A). The regions of the lid and binding pocket described in text are colored in light green and pink, respectively.
Figure 9.
Figure 9.
GA Binding Activity of GID1 Is Enhanced by SLR1. (A) GA binding activity of Trx·His-GID1 with (black) and without (white) the full length of GST-SLR1 protein (means ± sd; n = 3). Approximately equal amounts of proteins (∼3.2 μg) of Trx·His-GID1, Trx·His vec, GST-SLR1, and GST vector were used. (B) Association kinetics of 3H-16,17-dihydro-GA4 and Trx·His-GID1 with (closed symbols) and without (open symbols) the full length of GST-SLR1, represented as percentage of the values reached after 60 min of reaction. Data are means ± sd; n = 3. (C) Dissociation kinetics of 3H-16,17-dihydro-GA4 and Trx·His-GID1 with (closed symbols) or without (open symbols) GST-SLR1, represented as a percentage of the value detected at 0 min. Data are means ± sd; n = 3.
Figure 10.
Figure 10.
Molecular Model for Formation of the GA-GID1-SLR1 Complex. See text for details.

Comment in

References

    1. Abe, M., Kobayashi, Y., Yamamoto, S., Daimon, Y., Yamaguchi, A., Ikeda, Y., Ichinoki, H., Notaguchi, M., Goto, K., and Araki, T. (2005). FD, a bZIP protein mediating signals from the floral pathway integrator FT at the shoot apex. Science 309 1052–1056. - PubMed
    1. Chandler, P.M., Marion-Poll, A., Ellis, M., and Gubler, F. (2002). Mutants at the Slender1 locus of barley cv Himalaya: Molecular and physiological characterization. Plant Physiol. 129 181–190. - PMC - PubMed
    1. Cuff, J.A., Clamp, M.E., Siddiqui, A.S., Finlay, M., and Barton, G.J. (1998). Jpred: A consensus secondary structure prediction server. Bioinformatics 14 892–893. - PubMed
    1. Davies, P.J. (1995). Plant Hormones. (Dordrecht, The Netherlands: Kluwer Academic Publishers).
    1. De Simone, G., Galdiero, S., Manco, G., Lang, D., Rossi, M., and Pedone, C. (2000). A snapshot of a transition state analogue of a novel thermophilic esterase belonging to the subfamily of mammalian hormone-sensitive lipase. J. Mol. Biol. 303 761–771. - PubMed

Publication types

MeSH terms

Associated data

LinkOut - more resources