

Bulge migration of the malondialdehyde OPdG DNA adduct when placed opposite a two-base deletion in the (CpG)3 frameshift hotspot of the Salmonella typhimurium hisD3052 gene
- PMID: 17645303
- PMCID: PMC2728581
- DOI: 10.1021/tx700121j
Bulge migration of the malondialdehyde OPdG DNA adduct when placed opposite a two-base deletion in the (CpG)3 frameshift hotspot of the Salmonella typhimurium hisD3052 gene
Abstract
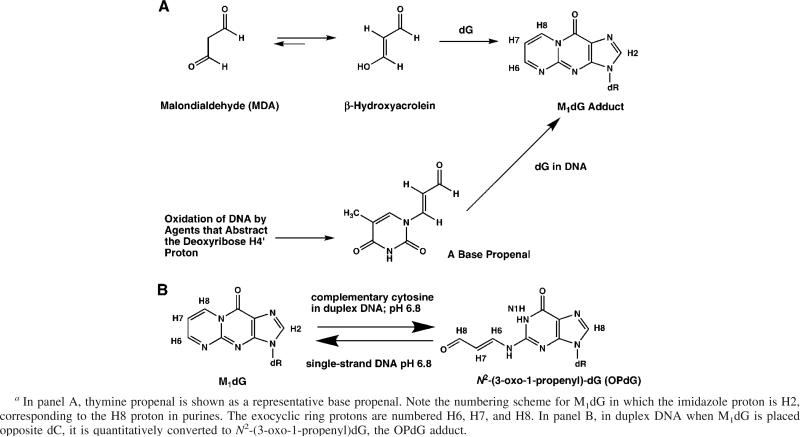
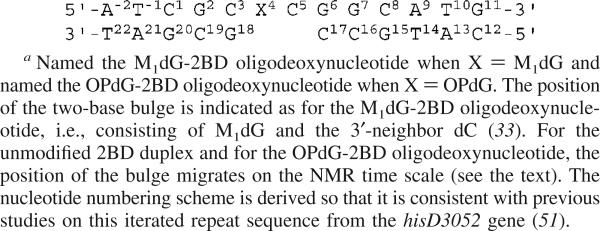
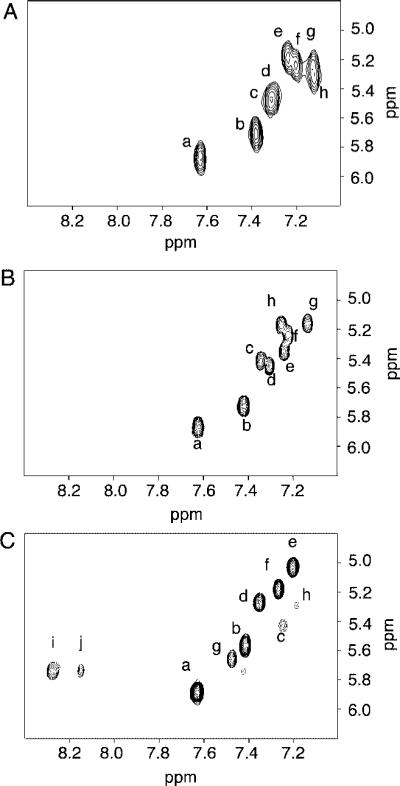
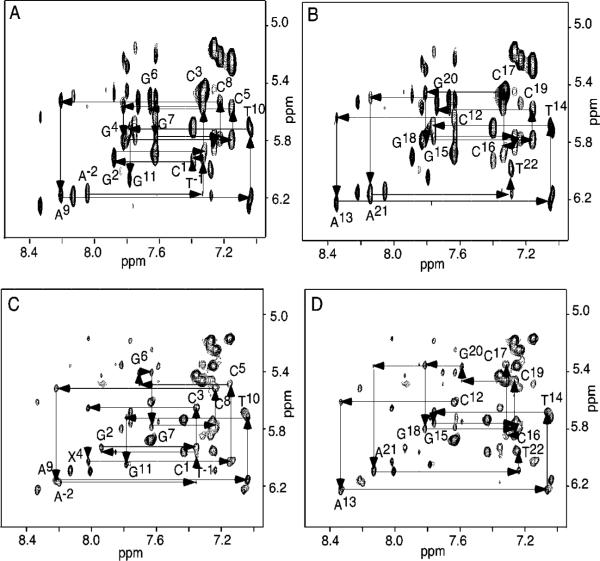
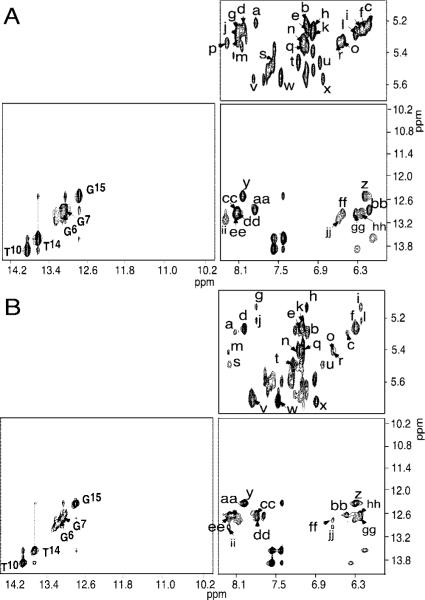
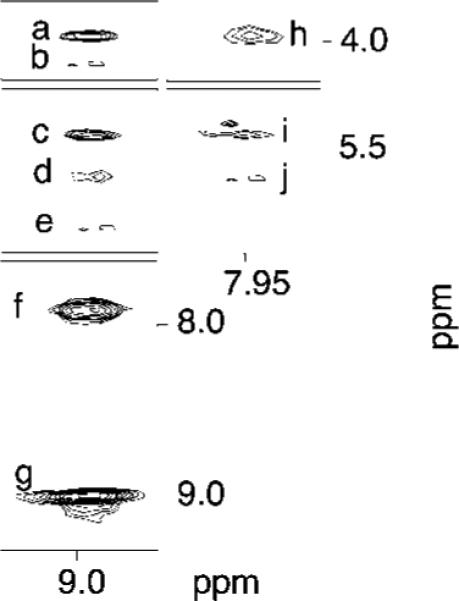
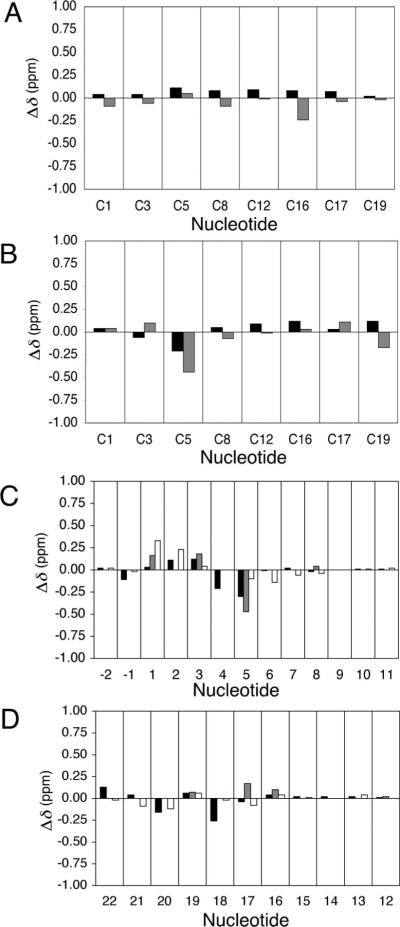
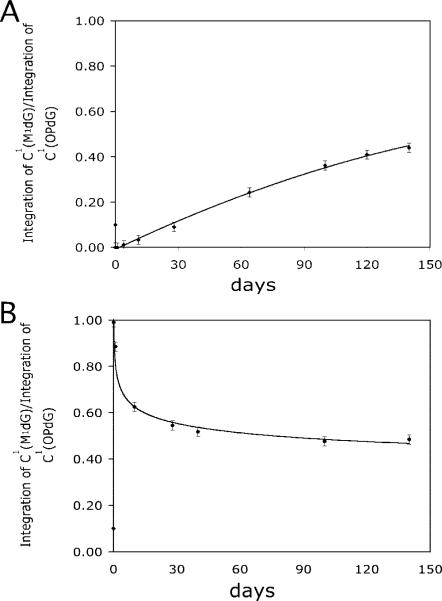
The OPdG adduct N (2)-(3-oxo-1-propenyl)dG, formed in DNA exposed to malondialdehyde, was introduced into 5'-d(ATCGC XCGGCATG)-3'.5'-d(CATGCCGCGAT)-3' at pH 7 (X = OPdG). The OPdG adduct is the base-catalyzed rearrangement product of the M 1dG adduct, 3-(beta- d-ribofuranosyl)pyrimido[1,2- a]purin-10(3 H)-one. This duplex, named the OPdG-2BD oligodeoxynucleotide, was derived from a frameshift hotspot of the Salmonella typhimuium hisD3052 gene and contained a two-base deletion in the complementary strand. NMR spectroscopy revealed that the OPdG-2BD oligodeoxynucleotide underwent rapid bulge migration. This hindered its conversion to the M 1dG-2BD duplex, in which the bulge was localized and consisted of the M 1dG adduct and the 3'-neighbor dC [ Schnetz-Boutaud, N. C. , Saleh, S. , Marnett, L. J. , and Stone, M. P. ( 2001) Biochemistry 40, 15638- 15649 ]. The spectroscopic data suggested that bulge migration transiently positioned OPdG opposite dC in the complementary strand, hindering formation of the M 1dG-2BD duplex, or alternatively, reverting rapidly formed intermediates in the OPdG to M 1dG reaction pathway when dC was placed opposite from OPdG. The approach of initially formed M 1dG-2BD or OPdG-2BD duplexes to an equilibrium mixture of the M 1dG-2BD and OPdG-2BD duplexes was monitored as a function of time, using NMR spectroscopy. Both samples attained equilibrium in approximately 140 days at pH 7 and 25 degrees C.
Figures
Similar articles
-
The exocyclic 1,N2-deoxyguanosine pyrimidopurinone M1G is a chemically stable DNA adduct when placed opposite a two-base deletion in the (CpG)3 frameshift hotspot of the Salmonella typhimurium hisD3052 gene.Biochemistry. 2001 Dec 25;40(51):15638-49. doi: 10.1021/bi011242u. Biochemistry. 2001. PMID: 11747439
-
Structure of the malondialdehyde deoxyguanosine adduct M1G when placed opposite a two-base deletion in the (CpG)3 frameshift hotspot of the Salmonella typhimurium hisD3052 gene.Adv Exp Med Biol. 2001;500:513-6. doi: 10.1007/978-1-4615-0667-6_77. Adv Exp Med Biol. 2001. PMID: 11764989
-
Solution structure of an oligodeoxynucleotide containing the malondialdehyde deoxyguanosine adduct N2-(3-oxo-1-propenyl)-dG (ring-opened M1G) positioned in a (CpG)3 frameshift hotspot of the Salmonella typhimurium hisD3052 gene.Biochemistry. 1999 Oct 12;38(41):13491-501. doi: 10.1021/bi9910124. Biochemistry. 1999. PMID: 10521256
-
Structure of an oligodeoxynucleotide containing a 1,N(2)-propanodeoxyguanosine adduct positioned in a palindrome derived from the Salmonella typhimurium hisD3052 gene: Hoogsteen pairing at pH 5.2.Chem Res Toxicol. 2002 Feb;15(2):127-39. doi: 10.1021/tx0101090. Chem Res Toxicol. 2002. PMID: 11849038
-
Chemistry and biology of DNA containing 1,N(2)-deoxyguanosine adducts of the alpha,beta-unsaturated aldehydes acrolein, crotonaldehyde, and 4-hydroxynonenal.Chem Res Toxicol. 2009 May;22(5):759-78. doi: 10.1021/tx9000489. Chem Res Toxicol. 2009. PMID: 19397281 Free PMC article. Review.
Cited by
-
3'-Intercalation of a N2-dG 1R-trans-anti-benzo[c]phenanthrene DNA adduct in an iterated (CG)3 repeat.Chem Res Toxicol. 2008 Jul;21(7):1348-58. doi: 10.1021/tx7004103. Epub 2008 Jun 13. Chem Res Toxicol. 2008. PMID: 18549249 Free PMC article.
-
Reactive species and DNA damage in chronic inflammation: reconciling chemical mechanisms and biological fates.Int J Cancer. 2011 May 1;128(9):1999-2009. doi: 10.1002/ijc.25815. Int J Cancer. 2011. PMID: 21387284 Free PMC article. Review.
-
Chemistry and structural biology of DNA damage and biological consequences.Chem Biodivers. 2011 Sep;8(9):1571-615. doi: 10.1002/cbdv.201100033. Chem Biodivers. 2011. PMID: 21922653 Free PMC article. Review.
References
-
- Marnett LJ. Lipid peroxidation-DNA damage by malondialdehyde. Mutat. Res. 1999;424:83–95. - PubMed
-
- Marnett LJ. Chemistry and biology of DNA damage by malondialdehyde. IARC Sci. Publ. 1999;150:17–27. - PubMed
-
- Basu AK, Essigmann JM. Site-specifically modified oligodeoxynucleotides as probes for the structural and biological effects of DNA-damaging agents. Chem. Res. Toxicol. 1988;1:1–18. - PubMed
-
- Marnett LJ, Basu AK, O'Hara SM, Weller PE, Rahman AFMM, Oliver JP. Reaction of malondialdehyde with guanine nucleosides: Formation of adducts containing oxadiazabicyclononene residues in the base-pairing region. J. Am. Chem. Soc. 1986;108:1348–1350.
-
- Seto H, Okuda T, Takesue T, Ikemura T. Reaction of malonaldehyde with nucleic acid. I. Formation of fluorescent pyrimido [1,2-a]purin-10(3H)-one nucleosides. Bull. Chem. Soc. Jpn. 1983;56:1799–1802.
Publication types
MeSH terms
Substances
Grants and funding
LinkOut - more resources
Full Text Sources
