. 2007;8(7):R145.
doi: 10.1186/gb-2007-8-7-r145.

Global analysis of patterns of gene expression during Drosophila embryogenesis

Affiliations

Global analysis of patterns of gene expression during Drosophila embryogenesis

Pavel Tomancak et al. Genome Biol. 2007.

Abstract

Background: Cell and tissue specific gene expression is a defining feature of embryonic development in multi-cellular organisms. However, the range of gene expression patterns, the extent of the correlation of expression with function, and the classes of genes whose spatial expression are tightly regulated have been unclear due to the lack of an unbiased, genome-wide survey of gene expression patterns.

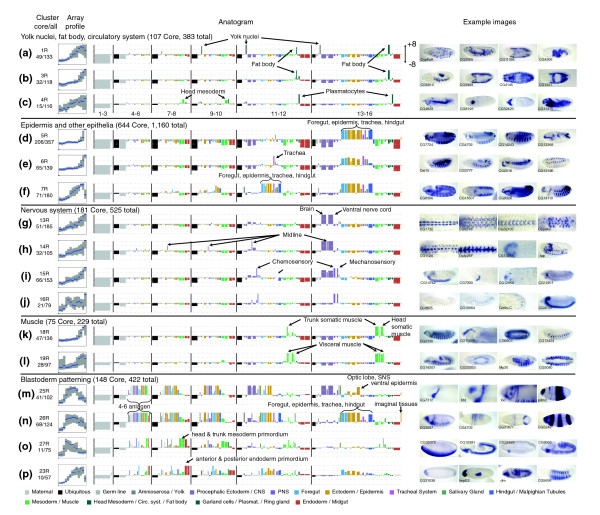
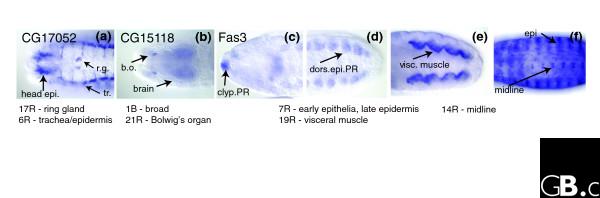
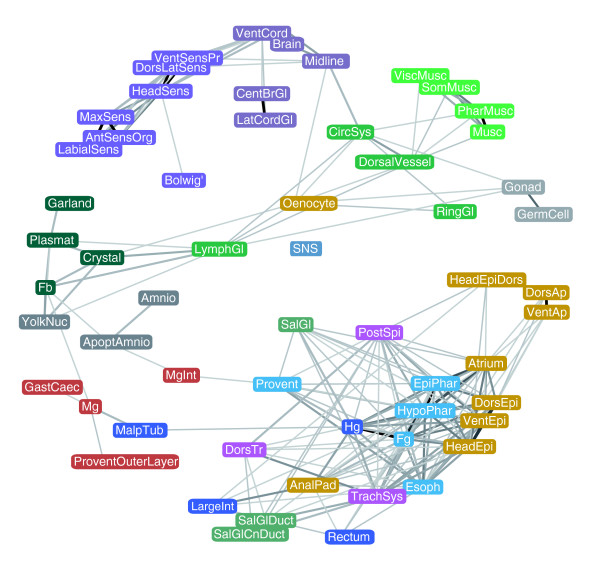
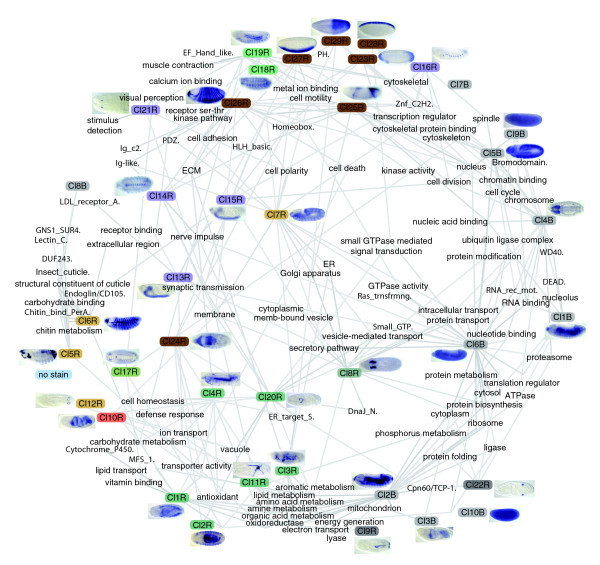
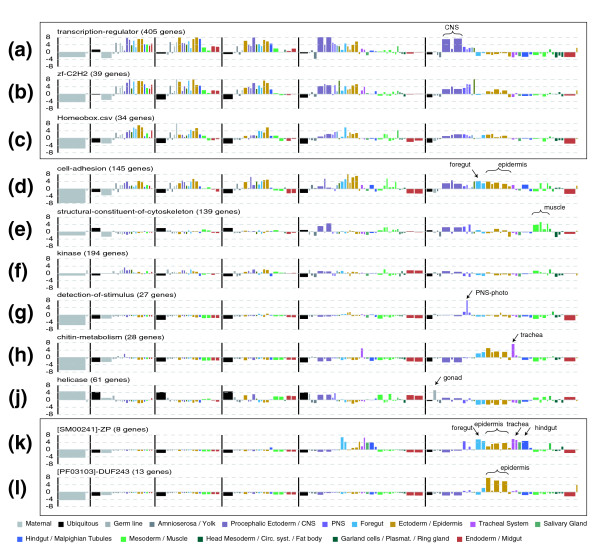
Results: We determined and documented embryonic expression patterns for 6,003 (44%) of the 13,659 protein-coding genes identified in the Drosophila melanogaster genome with over 70,000 images and controlled vocabulary annotations. Individual expression patterns are extraordinarily diverse, but by supplementing qualitative in situ hybridization data with quantitative microarray time-course data using a hybrid clustering strategy, we identify groups of genes with similar expression. Of 4,496 genes with detectable expression in the embryo, 2,549 (57%) fall into 10 clusters representing broad expression patterns. The remaining 1,947 (43%) genes fall into 29 clusters representing restricted expression, 20% patterned as early as blastoderm, with the majority restricted to differentiated cell types, such as epithelia, nervous system, or muscle. We investigate the relationship between expression clusters and known molecular and cellular-physiological functions.

Conclusion: Nearly 60% of the genes with detectable expression exhibit broad patterns reflecting quantitative rather than qualitative differences between tissues. The other 40% show tissue-restricted expression; the expression patterns of over 1,500 of these genes are documented here for the first time. Within each of these categories, we identified clusters of genes associated with particular cellular and developmental functions.


Figures

Figure 1
Figure 1
Normalized anatomical signature - the anatogram. A linear representation of the CV is used to show the enrichment of annotations within the set of all 3,334 maternally expressed genes versus the entire dataset of 4,759 genes expressed in the embryo. A vertical black line delimits stages, and each colored bar represents an individual CV term (an expanded color key is shown in Additional_data_fille 3). The width of each bar is proportional to the number of times a term was used in our entire dataset, and the height represents the relative enrichment of the given term within the particular gene set (in this case, all maternally expressed genes). Enrichment is given in units of standard deviation above or below the expected sample count based on the background frequencies (z-score). Terms with bars below the zero line are under-represented in the sample. The green asterisk corresponds to the 'amnioserosa' term, while the red asterisk corresponds to the 'brain' term. On the web supplement [21], the user can place the mouse pointer over any bar in the anatomical signature (arrow on the midgut bar in stage range 13-16) and obtain the gene count for the term in the entire dataset, the gene count within the particular set of genes under study, and a statistical p value of statistical over- or under-representation within the set (shown in the black bordered lavender box).
Figure 2
Figure 2
Microarray data can supplement, but not supplant, in situ gene expression patterns. Microarray data and the CV annotations are shown for genes (a) restricted to particular tissues late in embryogenesis, and (b,c) for broadly expressed genes encoding basic cellular protein complexes. Genes in (a) show strikingly similar array profiles but are expressed in quite diverse tissues. Late in embryogenesis half resolve to the epidermis (*e), and the other half are expressed in muscle (*m), fat body (*fb), and nervous system (*n). The genes of the DNA replication complexes, origin recognition complex and minichromosome maintenance complex display a characteristic pattern with peak expression at hour 5 (stage 10) and late expression in CNS (b). Similarly, the mitochondrial ribosomal genes decline during early embryogenesis but begin to rise around hour 10 (stage 13), with in situ hybridization most common in the midgut and muscle (c). For these broadly expressed gene classes the similarity of the microarray profiles is useful for supplementing the description of the in situ hybridization patterns using the CV annotations.
Figure 3
Figure 3
Clustered gene expression data for broadly expressed genes. We divided broadly expressed genes into 10 clusters labeled 1B-10B, each cluster separated by a horizontal black bar. From the left, we show normalized eisengrams [43] representing microarray data for 13 one-hour time points (yellow relative high expression, blue relative low expression), followed by annotation matrices split by stage range and color-coded according to organ systems. On the right is a magnified view of clusters 2B and 4B highlighting the diversity of annotations for subsets of genes.
Figure 4
Figure 4
Overview of broad expression patterns. For the core genes in each broad cluster, we summarize the array profile, the annotation profile (anatogram), the number of total and core genes in the cluster and show one image for each stage of embryogenesis for a single representative gene. Array plots show the distribution of scaled intensity scores: the blue line indicates the median value while the gray box gives the inter-quartile range. The green rectangle shows that staining patterns of all broad genes are remarkably similar immediately after gastrulation. The representative late stage embryos (boxed in red) illustrate the relative diversity into which each of these homogenous early patterns resolve.
Figure 5
Figure 5
Clustered gene expression data for genes expressed in a restricted manner. We divided genes with restricted expression patterns into 29 clusters labeled 1R-29R, each cluster separated by a horizontal black bar. We used the same conventions as described for the broad clusters to capture and display the microarray and embryonic expression data (see legend to Figure 4).
Figure 6
Figure 6
Overview of the restricted expression patterns. For unique genes in each cluster, we summarized the array profiles, diversity of annotation terms (as an anatogram), and number of total and core genes and show two to four embryo images. Whenever possible, genes with previously uncharacterized expression patterns were selected. Array plots show the distribution of scaled intensity scores: the blue line indicates the median value while the gray box gives the inter-quartile range. The most relevant annotation terms in each anatogram are labeled.
Figure 7
Figure 7
Genes classified in multiple clusters. (a) CG17052 is expressed in the ring gland as well as a number of epithelial structures at stage 14. It belongs to two clusters: 17R, the ring gland (r.g.); and 6R, the late epithelial pattern with trachea (tr.). (b) CG15118 is expressed specifically in Bolwig's organ (b.o.), along with broad staining in the brain, ventral nerve cord, anal pad, hindgut, and faintly throughout the embryo. It is classified as belonging to a broad cluster, 1B, as well as the Bolwig's organ cluster, 21R. (c-f) Fas3 has a complex expression pattern and is annotated with 27 individual annotation terms. At stage 12, it is expressed in various epithelia, including the clypeolabrum PR (clyp.PR) (c) and dorsal epidermis primordium (dorsi.epi.PR) (d), the visceral muscle PR (e) and the brain PR (not shown). At stage 15, Fas-3 is expressed in the central nervous system, including the midline, along with visceral muscle and various epithelial structures, including the trachea, hindgut, foregut, clypeolabrum, and epidermis (epi) (f). Fas-3 belongs to three clusters: 7R, the early epithelial pattern; 19R, visceral muscle; and 14R, the midline/CNS cluster.
Figure 8
Figure 8
Network representation of tissue relatedness. Nodes represent collapsed annotation terms and edges represent the correlation between expression in each pair of terms. Only tissues that share a statistically significant number of genes are linked and the strength of the links is proportional to the number of genes the two tissues have in common. Tissues that share very few or no genes repel each other. The system is allowed to reach a low energy level in two-dimensional space under a physical spring model (force directed layout). Collapsed annotation terms are color-coded according to their organ system assignments as used throughout.
Figure 9
Figure 9
Distribution of GO annotations and Uniprot domains within broad versus restricted clusters. GO annotations (left) and Uniprot domains (right) are plotted on a number line according to the relative fraction of genes contained within broad versus restricted expression clusters. We label categories where at least 80% of the genes with patterns belong to either broad or restricted clusters.
Figure 10
Figure 10
Network representation of the relationship between gene expression and gene function. Thirty-nine gene expression clusters (broad and restricted) together with the most significantly enriched GO terms and Uniprot domains (italicized) are organized in two-dimensional space by a force directed layout as in Figure 9. The strength of links between expression clusters and GO/Uniprot terms is determined by the level of enrichment of the GO/Uniprot term within the expression cluster (using z-scores in Additional data file 8). The strength of links between pairs of expression clusters and pairs of GO/Uniprot terms are determined by comparing similarity with respect to the opposite class (so that expression clusters are compared with respect to the GO/Uniprot terms they have similarity with, and vice versa; see Materials and methods). Expression cluster representative in situ images: Cl1B CG12792; Cl2B CG4567; Cl3B CG4078; Cl4B CG2656; Cl5B CG3227; Cl6B CG7375; Cl9B CG8464; Cl10B CG13349; Cl1R CG3246; Cl2R CG8066; Cl3R CG2233; Cl4R CG4829; Cl5R Osi14; Cl6R CG32209; Cl7R CG12676; Cl8R CG14756; Cl9R CG10527; Cl10R CG1246; Cl11R CG6337; Cl12R CG9468; Cl13R CG15651; Cl14R CG31764; Cl15R CG14762; Cl16R CG18675; Cl17R CG8888; Cl18R CG6429; Cl19R CG8780; Cl20R CG15209; Cl21R CG4468; Cl22R CG9925; Cl23R rib; Cl24R CG8147; Cl25R CG8965; Cl26R odd; Cl27R CG12177; Cl28R CG13653; Cl29R CG10967.
Figure 11
Figure 11
Anatogram summary for selected GO and Uniprot categories. Anatograms are used to summarize gene expression for selected (a-j) GO terms and (k,l) Uniprot protein domains. Categories related to transcriptional regulation (a-c) are boxed, as are two categories strongly enriched in clusters 5R and 6R representing epithelial patterns (k,l). Tissues discussed in the main text are labeled.

References

    1. Brown PO, Botstein D. Exploring the new world of the genome with DNA microarrays. Nat Genet. 1999;21:33–37. - PubMed
    1. Jones KW, Robertson FW. Localisation of reiterated nucleotide sequences in Drosophila and mouse by in situ hybridisation of complementary RNA. Chromosoma. 1970;31:331–345. - PubMed
    1. Tautz D, Pfeifle C. A non-radioactive in situ hybridization method for the localization of specific RNAs in Drosophila embryos reveals translational control of the segmentation gene hunchback. Chromosoma. 1989;98:81–85. - PubMed
    1. Arbeitman MN, Furlong EE, Imam F, Johnson E, Null BH, Baker BS, Krasnow MA, Scott MP, Davis RW, White KP. Gene expression during the life cycle of Drosophila melanogaster. Science. 2002;297:2270–2275. - PubMed
    1. Furlong EE, Andersen EC, Null B, White KP, Scott MP. Patterns of gene expression during Drosophila mesoderm development. Science. 2001;293:1629–1633. - PubMed

Publication types

MeSH terms

LinkOut - more resources