. 2007 Aug 6;204(8):1923-33.
doi: 10.1084/jem.20062373. Epub 2007 Jul 23.

Organ-dependent in vivo priming of naive CD4+, but not CD8+, T cells by plasmacytoid dendritic cells

Affiliations

Organ-dependent in vivo priming of naive CD4+, but not CD8+, T cells by plasmacytoid dendritic cells

Anita Sapoznikov et al. J Exp Med. .

Abstract

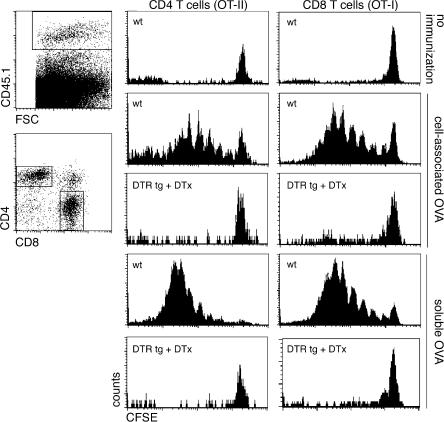
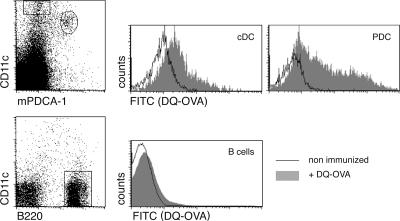
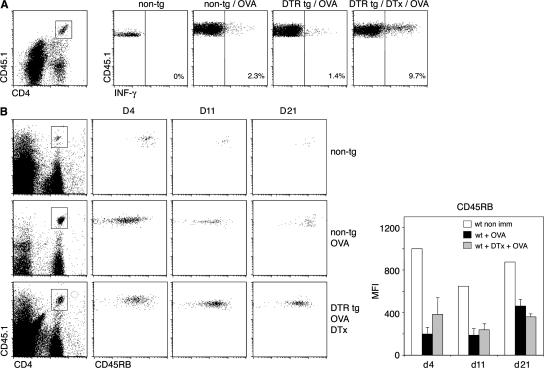
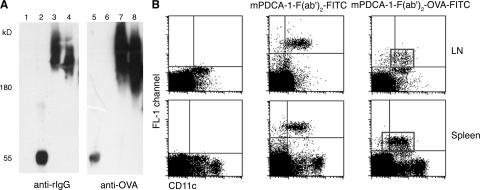
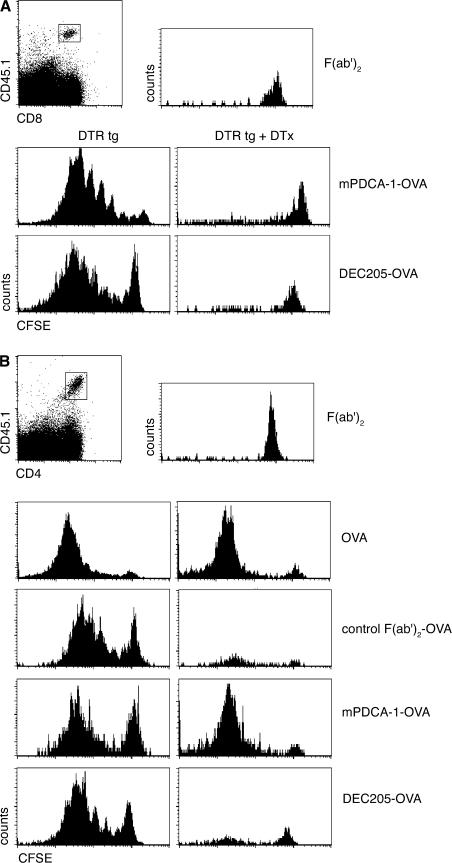
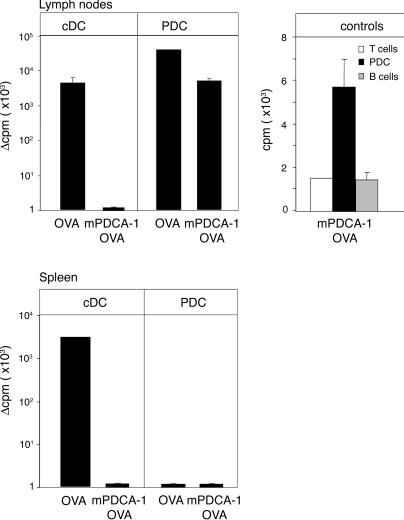
Plasmacytoid dendritic cells (PDCs) play a pivotal role as cytokine-secreting accessory cells in the antimicrobial immune defense. In contrast, the capacity of PDCs to act as antigen-presenting cells in naive T cell priming remains unclear. By studying T cell responses in mice that lack conventional DCs (cDCs), and by the use of a PDC-specific antigen-targeting strategy, we show that PDCs can initiate productive naive CD4(+) T cell responses in lymph nodes, but not in the spleen. PDC-triggered CD4(+) T cell responses differed from cDC-driven responses in that they were not associated with concomitant CD8(+) T cell priming. Our results establish PDCs as a bona fide DC subset that initiates unique CD4(+) Th cell-dominated primary immune responses.


Figures

Figure 1.
Figure 1.
PDCs are spared from ablation in DTx-treated CD11c-DTR transgenic mice. (A) Flow cytometric analysis of the spleens of untreated controls and CD11c-DTR transgenic mice 1 d after i.v. injection of DTx (4 ng/body weight). cDCs are gated as CD11chigh mPDCA-1neg cells; PDCs are defined as being CD11cint mPDCA-1+. (left) Dot blots show cells gated according to scatter. (right) The bar graph represents analysis of splenic cDCs and PDCs of untreated mice and mice 24 h after treatment (i.p. DTx; 10 μg OVA i.v.). n = 5 for each group. (B) DTR/GFP expression profiles of splenic cDCs and PDCs isolated from CD11c-DTRtg mice that were untreated or treated with DTx. Cells are defined and gated as in A. Graphs are representative of five repeats. Percentage refers to DTx-sensitive GFP+ mPDCA-1+ CD11clow cells (filled area). (C) Flow cytometric analysis of popliteal LNs of control mice CD11c-DTR transgenic mice 1 d after s.c. injection of 20 ng DTx into the hind footpads. (left) Dot blots show cells gated according to scatter. (right) Histogram represents analysis of splenic cDCs and PDCs of untreated mice and mice 24 h after the indicated treatment (i.p. DTx; 10 μg OVA i.v.). n = 5 for each group. (D) DTR-GFP expression profiles of LN PDCs isolated from untreated or treated CD11c-DTRtg mice. Note absence of GFP+ mPDCA-1+ CD11clow subpopulation observed in spleen (B). (E) IFN-α production by splenic PDC and non-PDC cell fractions isolated from noninjected or DTx-injected CD11c-DTRtg mice and incubated in vitro for 20 h in the presence or absence of 400 HAU/ml influenza virus and blood sera analysis of DTx-treated and untreated CD11c-DTRtg mice, 6 h after PBS or 100 μg CpG i.v. injection. Error bars depict the SD.
Figure 2.
Figure 2.
cDC ablation impairs splenic CD4+ and CD8+ T cell priming. Flow cytometric analysis of cotransferred CFSE-labeled CD45.1+ OT-I and -II T cell grafts (106 cells each) in DTx-treated nontransgenic and CD11c-DTR transgenic mice (CD45.2) 4 d after i.v. immunization with OVA-loaded splenocytes or soluble OVA. Histograms represent cells gated according to scatter, CD45.1, and CD8 or CD4 surface expression, as indicated in the dot plots. Data show results of one representative experiment out of three.
Figure 3.
Figure 3.
Ablation of cDCs impairs CD8+ T cell priming, but not CD4+ T cell priming, in the LNs. (A) Flow cytometric analysis of the popliteal LNs of CD11c-DTR transgenic mice during the course of a priming experiment. Mice were injected twice with DTx in the hind footpads, on day 1 and 3. The line graph represents the analysis of LN cDCs and PDCs as indicated in the FACS blots (top right). n = 3 for each group. The bottom diagram refers to T cell priming experiments performed in B. (B) Flow cytometric analysis of cotransferred CFSE-labeled CD45.1+ OT-I and -II cells (bottom row, OT-II transfer only) into DTx-treated nontransgenic and CD11c-DTR transgenic mice (CD45.2+) 4 d after s.c. immunization with soluble OVA. Histograms represent cells gated according to scatter, CD45.1, and CD8 or CD4 expression, as indicated in the dot plots. Data show results of 2 representative experiments out of 10 repeats. Graph summarizes percentages of dividing CFSE-labeled CD45.1+ OT-II cells in mice (n = 14) that were treated with DTx and immunized, compared with proliferation in immunized WT control mice (n = 8; set as 100%). Each dot represents an independent mouse.
Figure 4.
Figure 4.
In vivo antigen acquisition by PDCs. Flow cytometric analysis of popliteal LNs harvested 24 h after s.c. injection of DQ-OVA into hind footpads. Histograms represent analysis of DQ-OVA uptake by cDCs (CD11chigh mPDCA-1), PDCs (CD11cint mPDCA-1+), and B cells (CD11c B220+). Results are representative of two independent experiments.
Figure 5.
Figure 5.
CD4+ T cells that are primed in the absence of cDCs differentiate into Th cells with memory phenotype and persist for extended periods of time. (A) CFSE-labeled CD45.1+ OT-II cells were transferred into nontransgenic and CD11c-DTR transgenic mice (CD45.2+). 1 d later, mice were treated s.c. with DTx; 8 h later, they were immunized in their hind footpads with OVA and CpG. 3 d after immunization, IFN-γ production in the popliteal LN was assessed after in vivo restimulation with OVA peptide, 2 h before removal of popliteal LNs. Data represent IFN-γ profiles after gating on CD4+ CD45.1+ lymphocytes. Results are representative of two independent experiments. (B) CFSE-labeled CD45.1+ OT-II cells were transferred into mixed [WT > WT] or [DTRtg > WT] BM chimeras (CD45.2+). The mice were injected s.c. with DTx 1 d after the transfer, and they were immunized 8 h later with OVA injected into their hind footpads. Sequential s.c. DTx injections were performed every second day until day 21. Blood was collected on day 4, 11, and 21 and evaluated for the presence of OT-II cells (CD4+ CD45.1+) and expression of the memory T cell marker CD45RB. Bar graph depicts mean fluorescence intensity values of blood staining for CD45RB on day 4, 11, and 21. Results are representative of two independent experiments.
Figure 6.
Figure 6.
Characterization of selective APC targeting via the anti–mPDCA-1–F(ab')2–OVA construct. (A) Western blot analysis of the OVA-conjugated antibody construct. Free OVA and unconjugated or OVA-conjugated anti–mPDCA-1 antibody constructs were resolved by SDS-PAGE (4-12% gradient Tris-glycine gel) and, after immunoblotting, detected with anti–rat and anti-OVA antibody, respectively. Lanes 1 and 5 contain free OVA, lanes 2 and 6 contain the unconjugated anti–mPDCA-1–F(ab')2 antibody fragment, and lanes 3 and 4 and 7 and 8 contain two fractions of the anti–mPDCA-1–F(ab')2–OVA conjugate. (B) Specific in vivo targeting of PDCs with FITC-labeled anti–mPDCA-1–F(ab')2–OVA. Conjugates were injected i.v. or s.c. and, after 3 h, spleens and popliteal and inguinal LNs were isolated. Counterstaining with CD11c was performed on single-cell preparations from untreated (left dot plots) or in vivo–targeted cells (middle and right dot plots). Note that the staining in the FL-1 channel is based on the in vivo–injected, FITC-coupled mPDCA-1–F(ab')2–OVA construct.
Figure 7.
Figure 7.
In vivo antigen targeting of PDCs leads to priming of LN CD4+ T cells, but not CD8+ T cells, in the absence of cDCs. (A) Flow cytometric analysis of transferred CFSE-labeled CD45.1+ OT-I cells into s.c. DTx-treated CD11c-DTR transgenic mice (CD45.2) 4 d after footpad immunization with 8 μg mPDCA-1–OVA (OVA content, ∼7.5%) or 7 ng DEC205–OVA (OVA content, ∼10%). Histograms represent CFSE profiles of cells gated according to CD45.1 and CD8 expression, as indicated in the dot plot. Data show a representative result for three experiments. (B) Flow cytometric analysis of transferred CFSE-labeled CD45.1+ OT-II cells into DTx-treated CD11c-DTR transgenic mice, 4 d after footpad immunization with F(ab)2, OVA, control F(ab)2–OVA, mPDCA-1–F(ab)2–OVA, or DEC20-OVA. Histograms represent CFSE profiles of cells gated according to CD45.1 and CD4 expression, as indicated in the dot plot. Data show one representative experiment out of three.
Figure 8.
Figure 8.
In vivo antigen targeting of PDCs leads to LN PDC-mediated in vitro CD4+ T cell proliferation. CD11chigh cDCs, PDCs, and B cells were sorted from spleens and LNs of BALB/c mice that were i.v. or s.c. immunized with OVA or mPDCA-1–F(ab')2–OVA, and cultured with OVA-specific CD4+ T cells (DO11.10) for 72 h, after which thymidine incorporation was measured. Results are plotted as the arithmetic mean of cycles per minute (cpm) from triplicate cultures with cells isolated from immunized mice minus the mean cpm of cultures of the respective cell populations isolated from unimmunized mice. The absolute mean cpm for the LN cells were as follows: 4,297 (cDC/OVA); 30,537 (LNPDC/OVA); 5,065 (LNPDC mPDCA-1–OVA); and 2,995 for spleen cells (cDC/OVA). The positive fraction of PDCs contained <0.01% contaminating CD11chigh cDCs. n = 4 for each group. Error bars represent the SD. Controls include responder T cells only and T cells with B cells isolated from PDCA-OVA immunized mice.

Similar articles

Cited by

References

    1. Liu, Y.J. 2005. IPC: professional type 1 interferon-producing cells and plasmacytoid dendritic cell precursors. Annu. Rev. Immunol. 23:275–306. - PubMed
    1. Kadowaki, N., S. Ho, S. Antonenko, R.W. Malefyt, R.A. Kastelein, F. Bazan, and Y.J. Liu. 2001. Subsets of human dendritic cell precursors express different toll-like receptors and respond to different microbial antigens. J. Exp. Med. 194:863–869. - PMC - PubMed
    1. Kawai, T., S. Sato, K.J. Ishii, C. Coban, H. Hemmi, M. Yamamoto, K. Terai, M. Matsuda, J. Inoue, S. Uematsu, et al. 2004. Interferon-alpha induction through Toll-like receptors involves a direct interaction of IRF7 with MyD88 and TRAF6. Nat. Immunol. 5:1061–1068. - PubMed
    1. Lennert, K., and W. Remmele. Karyometric research on lymph node cells in man. I. Germinoblasts, lymphoblasts & lymphocytes. 1958. Acta Haematol. 19:99–113. - PubMed
    1. Trinchieri, G., and D. Santoli. 1978. Anti-viral activity induced by culturing lymphocytes with tumor-derived or virus-transformed cells. Enhancement of human natural killer cell activity by interferon and antagonistic inhibition of susceptibility of target cells to lysis. J. Exp. Med. 147:1314–1333. - PMC - PubMed

Publication types