. 2007 Jul 31;104(31):12861-6.
doi: 10.1073/pnas.0702509104. Epub 2007 Jul 23.

Fasting-dependent glucose and lipid metabolic response through hepatic sirtuin 1

Affiliations

Fasting-dependent glucose and lipid metabolic response through hepatic sirtuin 1

Joseph T Rodgers et al. Proc Natl Acad Sci U S A. .

Abstract

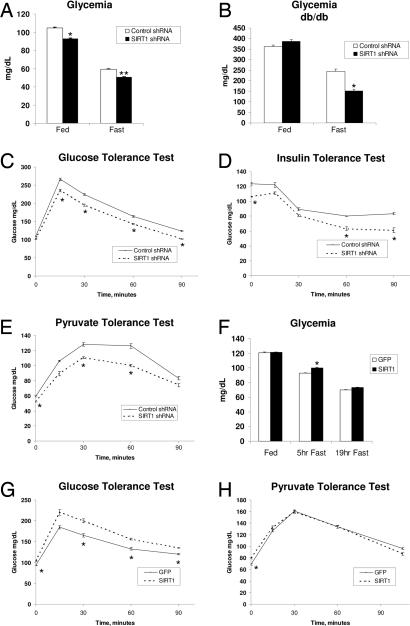
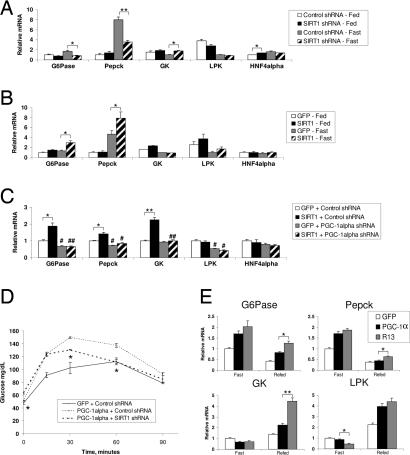
In the fasted state, induction of hepatic glucose output and fatty acid oxidation is essential to sustain energetic balance. Production and oxidation of glucose and fatty acids by the liver are controlled through a complex network of transcriptional regulators. Among them, the transcriptional coactivator PGC-1alpha plays an important role in hepatic and systemic glucose and lipid metabolism. We have previously demonstrated that sirtuin 1 (SIRT1) regulates genes involved in gluconeogenesis through interaction and deacetylation of PGC-1alpha. Here, we show in vivo that hepatic SIRT1 is a factor in systemic and hepatic glucose, lipid, and cholesterol homeostasis. Knockdown of SIRT1 in liver caused mild hypoglycemia, increased systemic glucose and insulin sensitivity, and decreased glucose production. SIRT1 knockdown also decreased serum cholesterol and increased hepatic free fatty acid and cholesterol content. These metabolic phenotypes caused by SIRT1 knockdown tightly correlated with decreased expression of gluconeogenic, fatty acid oxidation and cholesterol degradation as well as efflux genes. Additionally, overexpression of SIRT1 reversed many of the changes caused by SIRT1 knockdown and depended on the presence of PGC-1alpha. Interestingly, most of the effects of SIRT1 were only apparent in the fasted state. Our results indicate that hepatic SIRT1 is an important factor in the regulation of glucose and lipid metabolism in response to nutrient deprivation. As these pathways are dysregulated in metabolic diseases, SIRT1 may be a potential therapeutic target to control hyperglycemia and hypercholesterolemia.


Conflict of interest statement

The authors declare no conflict of interest.

Figures

Fig. 1.
Fig. 1.
Hepatic SIRT1 controls glucose metabolism. (A) Fed and fasted blood glucose levels of control and SIRT1 shRNA-infected mice. Data are presented as the average ± SEM of two independent experiments. Shown are control shRNA-infected mice [fed (n = 12), 20-h fasted (n = 12)] and SIRT1 shRNA-infected mice [fed (n = 13), 20-h fasted (n = 12)]. (B) Blood glucose levels from db/db mice infected with control shRNA (n = 5) or SIRT1 shRNA (n = 5) during feeding and during a short fast. (C) GTT. Control shRNA-infected (n = 5) and SIRT1 shRNA-infected (n = 6) mice were fasted 5 h before i.p. injection of 2 g/kg dextrose. (D) ITT. Control shRNA-infected (n = 5) and SIRT1 shRNA-infected (n = 5) mice were fasted 5 h before i.p. injection of 0.6 unit/kg insulin. (E) PTT. Control shRNA-infected (n = 7) and SIRT1 shRNA-infected (n = 7) mice were fasted 18 h before i.p. injection of 2 g/kg sodium pyruvate. (F) Blood glucose levels from mice infected with GFP or SIRT1 overexpression adenovirus. Feeding GFP and SIRT1 (n = 12), following a short 5-h fast (n = 6) or following a 19-h fast (n = 12). (G) GTT from GFP-infected (n = 6) or SIRT1-infected (n = 6) mice fasted for 5 h before injection of 2 g/kg dextrose. (H) PTT from GFP-infected (n = 6) and SIRT1-infected (n = 6) mice fasted for 18 h before injection with 2 g/kg pyruvate. All tolerance tests were performed in at least two independent experiments with similar results. Data are presented as the average ± SEM. Significance was determined by Student's t test. *, P < 0.05; **, P < 0.01.
Fig. 2.
Fig. 2.
Hepatic SIRT1 regulates genes involved in gluconeogenesis. (A) Quantitative RT-PCR analysis of expression of genes involved in liver glucose metabolism from mice in the fed state infected with control shRNA (n = 5) or SIRT1 shRNA (n = 6) or mice infected with control shRNA (n = 5) and SIRT1 shRNA (n = 5) and fasted for 20 h. (B) Fed, GFP (n = 6) or SIRT1 (n = 6); fasted for 19 h, GFP (n = 6) or SIRT1 (n = 6). (C) Double infection of GFP or SIRT1 overexpression and Control or PGC-1α shRNA (each bar, n = 9) following a 20-h fast. (D) PTT, PGC-1α overexpression, and SIRT1 knockdown. GFP + control shRNA-infected mice (n = 4), PGC-1α + control shRNA-infected mice (n = 4), and PGC-1α + SIRT1 shRNA-infected mice (n = 4) were fasted 18 h before i.p. injection of 2 g/kg sodium pyruvate. Significance indicated is between PGC-1α + control shRNA and PGC-1α + SIRT1 shRNA. (E) Quantitative RT-PCR analysis of gene expression of mice infected with GFP, PGC-1α overexpression, or R13 adenovirus fasted for 22 h (each bar, n = 4) or fasted for 22 h and refed overnight (16 h) (each bar, n = 5). All data are presented as the average ± SEM. Gene expression was normalized to 36b4 expression. Significance was determined by Student's t test. GFP/control shRNA vs. SIRT1/SIRT1 shRNA: *, P < 0.05; **, P < 0.01. Control shRNA vs. PGC-1α shRNA: #, P < 0.05; ##, P < 0.01.
Fig. 3.
Fig. 3.
Hepatic SIRT1 controls systemic and hepatic cholesterol and fatty acid homeostasis. (A) Liver free fatty acids (nonesterified fatty acids), serum total cholesterol, and liver cholesterol from control shRNA-infected fed (n = 5) and 20-h fasted (n = 5) mice and SIRT1 shRNA-infected fed (n = 6) and fasted (n = 5) mice. (B) Fed, GFP (n = 6) and SIRT1 (n = 6); 19-h fasted, GFP (n = 10) and SIRT1 (n = 10). (C) GFP or SIRT1 overexpression and control or PGC-1α shRNA double-infected mice (each bar, n = 5) following a 20-h fast. Liver measurements were normalized to protein content. Similar results for all measurements have been observed in at least two independent experiments. All data are presented as the average ± SEM. Significance was determined by Student's t test. GFP/control shRNA vs. SIRT1/SIRT1 shRNA: *, P < 0.05; **, P < 0.01. Control shRNA vs. PGC-1α shRNA: #, P < 0.05.
Fig. 4.
Fig. 4.
SIRT1 controls hepatic expression of genes involved in lipid metabolism. Quantitative RT-PCR was used to analyze genes involved in fatty acid and cholesterol metabolism. (A and D) Fed, control shRNA (n = 5) or SIRT1 shRNA (n = 6); fasted for 20 h, control shRNA (n = 5) and SIRT1 shRNA (n = 5). (B and E) Fed, GFP (n = 6) or SIRT1 (n = 6); fasted for 19 h, GFP (n = 6) or SIRT1 (n = 6). (C and F) Double infection with GFP or SIRT1 overexpression and control or PGC-1α shRNA (each bar, n = 9) following a 20-h fast. All data are presented as the average ± SEM normalized to 36b4 expression. Significance was determined by Student's t test. GFP/control shRNA vs. SIRT1/SIRT1 shRNA: *, P < 0.05; **, P < 0.01. Control shRNA vs. PGC-1α shRNA: #, P < 0.05; ##, P < 0.01.

References

    1. Rutter GA. Curr Biol. 2000;10:R736–738. - PubMed
    1. Michael MD, Kulkarni RN, Postic C, Previs SF, Shulman GI, Magnuson MA, Kahn CR. Mol Cell. 2000;6:87–97. - PubMed
    1. Muoio DM, Newgard CB. Annu Rev Biochem. 2006;75:367–401. - PubMed
    1. Pilkis SJ, Granner DK. Annu Rev Physiol. 1992;54:885–909. - PubMed
    1. Owen OE, Kalhan SC, Hanson RW. J Biol Chem. 2002;277:30409–30412. - PubMed

Publication types

MeSH terms