

Review
doi: 10.1007/s00330-007-0701-3.
Epub 2007 Jul 24.
MRI of the kidney-state of the art
Affiliations
- PMID: 17646992
- PMCID: PMC2039780
- DOI: 10.1007/s00330-007-0701-3
Item in Clipboard
Review
MRI of the kidney-state of the art
Eur Radiol.
2007 Nov.
Abstract
Ultrasound and computed tomography (CT) are modalities of first choice in renal imaging. Until now, magnetic resonance imaging (MRI) has mainly been used as a problem-solving technique. MRI has the advantage of superior soft-tissue contrast, which provides a powerful tool in the detection and characterization of renal lesions. The MRI features of common and less common renal lesions are discussed as well as the evaluation of the spread of malignant lesions and preoperative assessment. MR urography technique and applications are discussed as well as the role of MRI in the evaluation of potential kidney donors. Furthermore the advances in functional MRI of the kidney are highlighted.
Figures
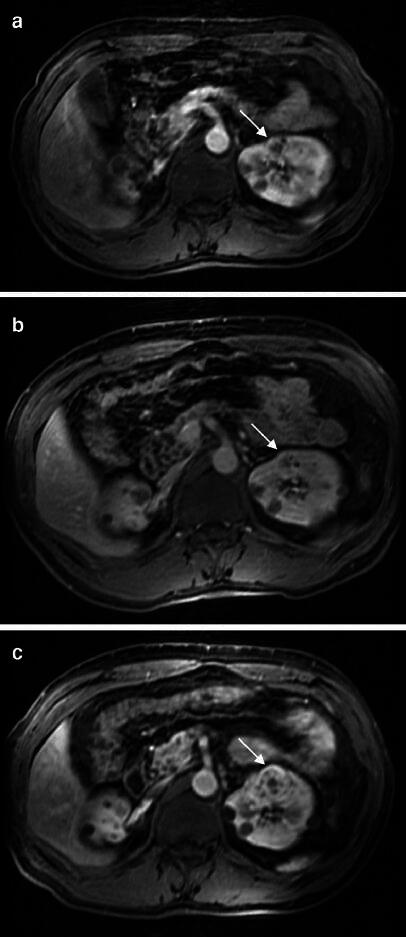
Gradient echo images with intravenous gadolinium at baseline (a), 8 months later (b) and 15 months later (c). The complicated cortical cyst (arrow) in the left kidney on image (a) in a patient with Von Hippel Lindau disease progresses into a frank renal cell carcinoma with multiple enhancing internal septations (c). Several simple cysts are visible. Images courtesy of Roy S. Dwarkasing

T2-weighted turbo spin echo sequence (a) showing a cystic multiloculated lesion in the left kidney (arrow) with high signal intensity content. The pre- and post-gadolinium images (b and c) show enhancement of the septations. Pathologic examination showed a cystic renal cell carcinoma
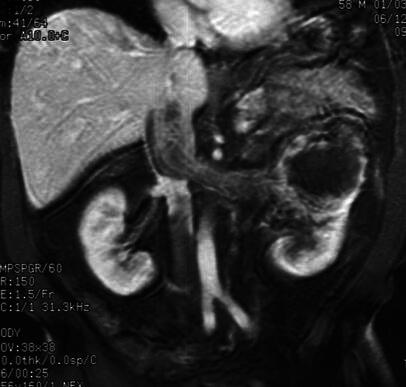
T1-weighted gradient echo sequence after intravenous contrast of a large renal cell carcinoma in the upper pole of the left kidney with tumor thrombus extending into the IVC up to the level of the liver

T1-weighted gradient echo images before (a) and after (b) gadolinium administration. A mass in the renal pelvis (arrow) shows moderate enhancement after gadolinium administration. A transitional cell carcinoma was suspected, which was confirmed after nephrectomy

Post-contrast fat-suppressed T1-weighted gradient echo images, arterial phase (a) and nephrographic phase (b) of a central oncocytoma (arrow). The tumor shows a hypointense central scar in the arterial phase. In the nephrographic phase, the central scar is slightly hyperintense
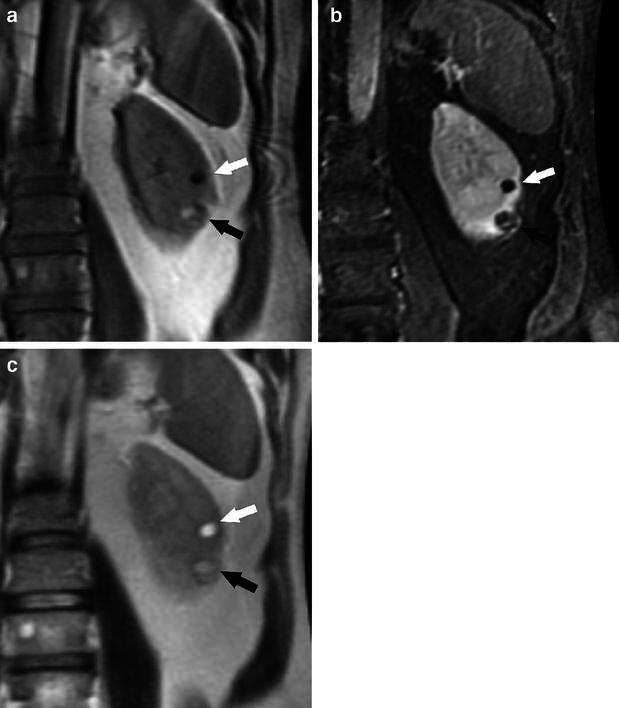
T1-weighted gradient echo image (a), post-contrast fat-suppressed T1-weighted gradient echo image (b), and T2-weighted HASTE (half Fourier single-shot turbo spin echo) image of the left kidney (c). The hyperintense parts of the tumor in the lower pole (black arrow) on the T1-weighted image show a drop in signal intensity on the post-contrast fat-suppressed T1-weighted image, proving the presence of fat, while the hypointense parts of the tumor enhance after gadolinium. The fatty portions are hyperintense on the T2-weighted sequence, but not as high as the cyst (white arrow) in the midportion of the kidney. The MRI characteristics of the tumor in the lower pole are consistent with angiomyolipoma

Lesion in the upper pole of the right kidney in a patient with tuberous sclerosis (arrow). The lesion shows low signal intensity on T2-weighted turbo spin echo images (a) and intermediate signal intensity on in-phase T1-weighted gradient echo images (b). No signal loss is observed on the out-of-phase T1-weighted gradient sequence (c). The lesion shows moderate enhancement after intravenous gadolinium administration (d). Pathologic examination after resection of the lesion showed an angiomyolipoma. In this unusual case, no macroscopic fat was detected on MRI
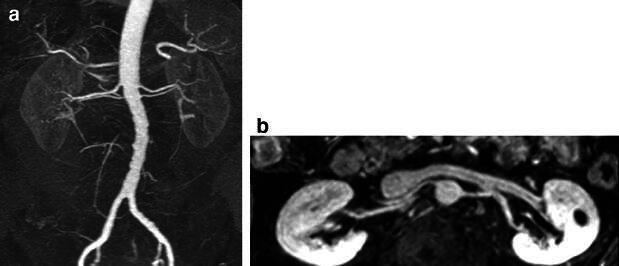
Pre-operative imaging of potential donor kidneys. a Gradient echo image after intravenous contrast, arterial phase, TR 3 ms, TE 1 ms, slice thickness 2.2 mm, flip angle 27°, coronal. b Gradient echo image after intravenous contrast, nephrographic phase, TR 4 ms, TE 1 ms, slice thickness 2.2 mm, flip angle 15°, coronal. The lower flip angle in the depiction of the renal veins was chosen to compensate for the lower gadolinium concentration in the renal veins
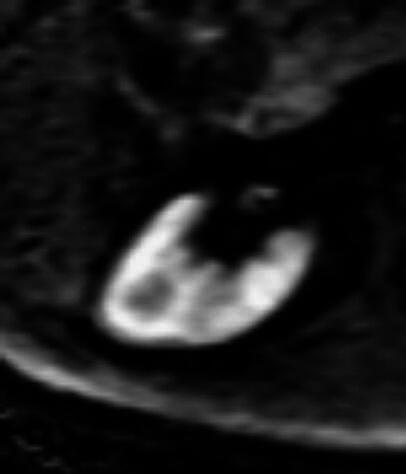
Diffusion-weighted tensor image of the right kidney on a 3T system. The renal pyramids show lower signal intensity than the surrounding parenchyma because of the radial orientation of the tubules in the pyramids, restricting the Brownian motion of the water molecules to one direction
References
-
- Huang AJ, Lee VS, Rusinek H (2004) Functional renal MR imaging. Magn Reson Imaging Clin N Am 12:469–486 - PubMed
-
- Martirosian P, Klose U, Mader I, Schick F (2004) FAIR true-FISP perfusion imaging of the kidneys. Magn Reson Med 51:353–361 - PubMed
-
- Niendorf ER, Grist TM, Lee FT Jr, Brazy PC, Santyr GE (1998) Rapid in vivo measurement of single-kidney extraction fraction and glomerular filtration rate with MR imaging. Radiology 206:791–798 - PubMed
-
- Hackstein N, Kooijman H, Tomaselli S, Rau WS (2005) Glomerular filtration rate measured using the Patlak plot technique and contrast-enhanced dynamic MRI with different amounts of gadolinium-DTPA. J Magn Reson Imaging 22:406–414 - PubMed
-
- Pedersen M, Dissing TH, Morkenborg J et al (2005) Validation of quantitative BOLD MRI measurements in kidney: application to unilateral ureteral obstruction. Kidney Int 67:2305–2312 - PubMed
Publication types
MeSH terms
LinkOut - more resources
Full Text Sources
Other Literature Sources
Medical
