Rise of oceanographic barriers in continuous populations of a cetacean: the genetic structure of harbour porpoises in Old World waters
- PMID: 17651495
- PMCID: PMC1971045
- DOI: 10.1186/1741-7007-5-30
Rise of oceanographic barriers in continuous populations of a cetacean: the genetic structure of harbour porpoises in Old World waters
Abstract
Background: Understanding the role of seascape in shaping genetic and demographic population structure is highly challenging for marine pelagic species such as cetaceans for which there is generally little evidence of what could effectively restrict their dispersal. In the present work, we applied a combination of recent individual-based landscape genetic approaches to investigate the population genetic structure of a highly mobile extensive range cetacean, the harbour porpoise in the eastern North Atlantic, with regards to oceanographic characteristics that could constrain its dispersal.
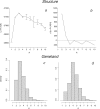
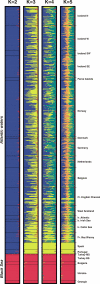
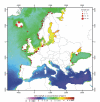
Results: Analyses of 10 microsatellite loci for 752 individuals revealed that most of the sampled range in the eastern North Atlantic behaves as a 'continuous' population that widely extends over thousands of kilometres with significant isolation by distance (IBD). However, strong barriers to gene flow were detected in the south-eastern part of the range. These barriers coincided with profound changes in environmental characteristics and isolated, on a relatively small scale, porpoises from Iberian waters and on a larger scale porpoises from the Black Sea.
Conclusion: The presence of these barriers to gene flow that coincide with profound changes in oceanographic features, together with the spatial variation in IBD strength, provide for the first time strong evidence that physical processes have a major impact on the demographic and genetic structure of a cetacean. This genetic pattern further suggests habitat-related fragmentation of the porpoise range that is likely to intensify with predicted surface ocean warming.
Figures


Similar articles
-
Genetic and historic evidence for climate-driven population fragmentation in a top cetacean predator: the harbour porpoises in European water.Proc Biol Sci. 2010 Sep 22;277(1695):2829-37. doi: 10.1098/rspb.2010.0412. Epub 2010 May 5. Proc Biol Sci. 2010. PMID: 20444724 Free PMC article.
-
Harbour Porpoises, Phocoena phocoena, in the Mediterranean Sea and Adjacent Regions: Biogeographic Relicts of the Last Glacial Period.Adv Mar Biol. 2016;75:333-358. doi: 10.1016/bs.amb.2016.08.006. Epub 2016 Sep 28. Adv Mar Biol. 2016. PMID: 27770989 Review.
-
Evolutionary history and seascape genomics of Harbour porpoises (Phocoena phocoena) across environmental gradients in the North Atlantic and adjacent waters.Mol Ecol Resour. 2025 Jul;25(5):e13860. doi: 10.1111/1755-0998.13860. Epub 2023 Sep 8. Mol Ecol Resour. 2025. PMID: 37681405 Free PMC article.
-
Postglacial climate changes and rise of three ecotypes of harbour porpoises, Phocoena phocoena, in western Palearctic waters.Mol Ecol. 2014 Jul;23(13):3306-21. doi: 10.1111/mec.12817. Epub 2014 Jun 19. Mol Ecol. 2014. PMID: 24888550
-
Long-term oceanographic and ecological research in the Western English Channel.Adv Mar Biol. 2005;47:1-105. doi: 10.1016/S0065-2881(04)47001-1. Adv Mar Biol. 2005. PMID: 15596166 Review.
Cited by
-
Genetic and historic evidence for climate-driven population fragmentation in a top cetacean predator: the harbour porpoises in European water.Proc Biol Sci. 2010 Sep 22;277(1695):2829-37. doi: 10.1098/rspb.2010.0412. Epub 2010 May 5. Proc Biol Sci. 2010. PMID: 20444724 Free PMC article.
-
Genetic homogeneity in the face of morphological heterogeneity in the harbor porpoise from the Black Sea and adjacent waters (Phocoena phocoena relicta).Heredity (Edinb). 2020 Mar;124(3):469-484. doi: 10.1038/s41437-019-0284-1. Epub 2019 Nov 26. Heredity (Edinb). 2020. PMID: 31772318 Free PMC article.
-
A new barrier to dispersal trapped old genetic clines that escaped the Easter Microplate tension zone of the Pacific vent mussels.PLoS One. 2013 Dec 2;8(12):e81555. doi: 10.1371/journal.pone.0081555. eCollection 2013. PLoS One. 2013. PMID: 24312557 Free PMC article.
-
A differential expression of pyrethroid resistance genes in the malaria vector Anopheles funestus across Uganda is associated with patterns of gene flow.PLoS One. 2020 Nov 10;15(11):e0240743. doi: 10.1371/journal.pone.0240743. eCollection 2020. PLoS One. 2020. PMID: 33170837 Free PMC article.
-
Population genetic structure of the malaria vector Anopheles funestus, in a recently re-colonized area of the Senegal River basin and human-induced environmental changes.Parasit Vectors. 2012 Sep 5;5:188. doi: 10.1186/1756-3305-5-188. Parasit Vectors. 2012. PMID: 22950576 Free PMC article.
References
-
- Palumbi SR. Genetic divergence, reproductive isolation and marine speciation. Annu Rev Ecol Syst. 1994;25:547–572. doi: 10.1146/annurev.es.25.110194.002555. - DOI
-
- Bekkevold D, Andre C, Dahlgren TG, Clausen LA, Torstensen E, Mosegaard H, Carvalho GR, Christensen TB, Norlinder E, Ruzzante DE. Environmental correlates of population differentiation in Atlantic herring. Evolution. 2005;59:2656–2668. - PubMed
Publication types
MeSH terms
LinkOut - more resources
Full Text Sources

