Review
. 2007 Oct 15;401(1-2):12-8.
doi: 10.1016/j.gene.2007.06.016. Epub 2007 Jul 3.

Meta-analysis of microarray results: challenges, opportunities, and recommendations for standardization

Affiliations
Review

Meta-analysis of microarray results: challenges, opportunities, and recommendations for standardization

Patrick Cahan et al. Gene. .

Abstract

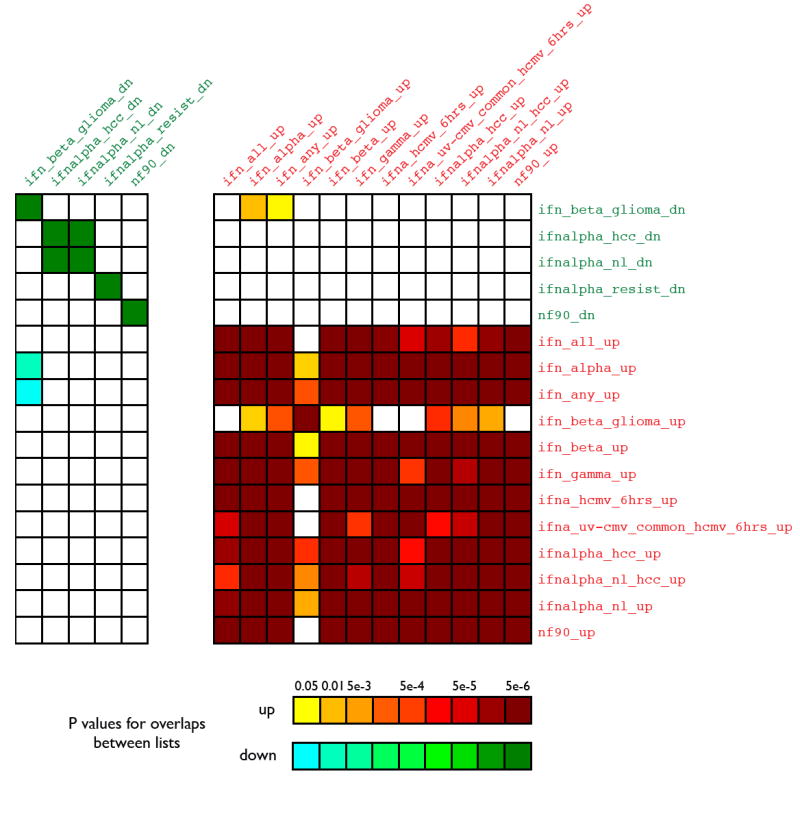
Microarray profiling of gene expression is a powerful tool for discovery, but the ability to manage and compare the resulting data can be problematic. Biological, experimental, and technical variations between studies of the same phenotype/phenomena create substantial differences in results. The application of conventional meta-analysis to raw microarray data is complicated by differences in the type of microarray used, gene nomenclatures, species, and analytical methods. An alternative approach to combining multiple microarray studies is to compare the published gene lists which result from the investigators' analyses of the raw data, as implemented in Lists of Lists Annotated (LOLA: www.lola.gwu.edu) and L2L (depts.washington.edu/l2l/). The present review considers both the potential value and the limitations of databasing and enabling the comparison of results from different microarray studies. Further, a major impediment to cross-study comparisons is the absence of a standard for reporting microarray study results. We propose a reporting standard: standard microarray results template (SMART), which will facilitate the integration of microarray studies.


Figures

Figure 1
Figure 1. Similarities between IFN-related gene lists in the L2L microarray database
The L2L and LOLA databases include a number of gene lists derived from published studies that investigated the effects of interferons (IFN) on gene expression, using disparate source materials and methods. Each IFN-related list was compared to all others using the L2L program, in order to determine the degree and statistical significance of any overlap between these ostensibly related gene lists. The figure is symmetric across the diagonal axis. Red denotes lists with up-regulation by interferon. Green denotes lists with down-regulation by interferon. Names of gene lists are as they appear in the database. Analysis of the same lists in LOLA produced highly similar outcomes (r = 0.994).
Figure 2
Figure 2. The effect of analytical strategies on the number of differentially expressed genes
LEFT: A set of microarray data (Affymetrix human U133A array, 22,283 genes total) from drug-treated vascular cells was analyzed by t-test at different p-value thresholds (α=.001, 0.005, 0.05, or 0.10, n=9 pairs) and the number of differentially expressed genes (DEGs) recorded (no correction for multiple testing). RIGHT: The same data was analyzed for DEGs by using a t-test (α=0.01) or a 2-fold change with different numbers of replicate pairs (1-9).

Similar articles

Cited by

References

    1. Ball CA, Brazma A. MGED standards: work in progress. Omics. 2006;10(2):138–44. - PubMed
    1. Bammler T, et al. Standardizing global gene expression analysis between laboratories and across platforms. Nat Methods. 2005;2(5):351–6. - PubMed
    1. Brazma A, et al. Minimum information about a microarray experiment (MIAME)-toward standards for microarray data. Nat Genet. 2001;29(4):365–71. - PubMed
    1. Brazma A, Parkinson H, Sarkans U, Shojatalab M, Vilo J, Abeygunawardena N, Holloway E, Kapushesky M, Kemmeren P, Lara G, Oezcimen A, Rocca-Serra P, Sansone S. ArrayExpress—a public repository for microarray gene expression data at the EBI. Nucleic Acids Res. 2003;31:68–71. - PMC - PubMed
    1. Bullinger L, Dohner K, Bair E, Frohling S, Schlenk RF, Tibshirani R, Dohner H, Pllack JR. Use of gene-expression profiling to identify prognostic subclasses in adult acute myeloid leukemia. N Engl J Med. 2004;350(16):1605–16. - PubMed

Publication types

LinkOut - more resources