Review
. 2008 Feb 12;363(1491):639-58.
doi: 10.1098/rstb.2007.2175.

Improving water use in crop production

Affiliations
Review

Improving water use in crop production

J I L Morison et al. Philos Trans R Soc Lond B Biol Sci. .

Abstract

Globally, agriculture accounts for 80-90% of all freshwater used by humans, and most of that is in crop production. In many areas, this water use is unsustainable; water supplies are also under pressure from other users and are being affected by climate change. Much effort is being made to reduce water use by crops and produce 'more crop per drop'. This paper examines water use by crops, taking particularly a physiological viewpoint, examining the underlying relationships between carbon uptake, growth and water loss. Key examples of recent progress in both assessing and improving crop water productivity are described. It is clear that improvements in both agronomic and physiological understanding have led to recent increases in water productivity in some crops. We believe that there is substantial potential for further improvements owing to the progress in understanding the physiological responses of plants to water supply, and there is considerable promise within the latest molecular genetic approaches, if linked to the appropriate environmental physiology. We conclude that the interactions between plant and environment require a team approach looking across the disciplines from genes to plants to crops in their particular environments to deliver improved water productivity and contribute to sustainability.


Figures

Figure 1
Figure 1
Generalized relationship between net CO2 assimilation rate (A) and stomatal conductance (gs). In many situations, the responses of A and gs to environmental and internal conditions are such that the rates are often near the ‘break point’ on the relationship (indicated by arrow). Reductions in gs below this point will reduce A by restricting CO2 diffusion, and increases above it will bring only small increases in A, while causing large increases in transpiration.
Figure 2
Figure 2
Relationship between the mean 13C discrimination (expressed as Δ, discrimination compared to air, ‰) and the mean ratio of net CO2 assimilation rate (A) to stomatal conductance (gs) for leaves of 15 varieties and accessions of mature coconut palms growing at Pottukulama Research Station, Sri Lanka in 2003. Bars indicate s.e.m., n=3. Line is linear regression, y=0.228x+22.7, R2=0.813, p<0.001. Results from Nainanayake (2004).
Figure 3
Figure 3
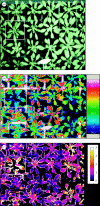
Images of the chlorophyll fluorescence parameter Fq′/Fm′ for Arabidopsis thaliana wild-type plants grown (a) well watered (control) and (b) in a slowly developing drought (droughted). Note the smaller droughted plant and the difference in photosynthetic efficiency between young and older leaves. Images courtesy of T. Lawson, University of Essex.
Figure 4
Figure 4
(a) Visible image of Arabidopsis thaliana wild-type and OST mutants growing in a controlled environment cabinet. The ‘dry’ reference surface (white area) is visible. (b) Thermal image of same plants. OST mutant plant shown within white box is cooler (mean leaf temperature 19.9°C) compared with wild-type plants (mean leaf temperature range 20.3–21.0°C). (c) Calculated index of conductance (Ig) for the image in (b), calculated from temperature of leaves and dry and wet reference surfaces, using the method of Jones (1999).
Figure 5
Figure 5
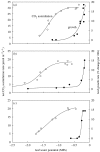
Response of net CO2 assimilation rates (open circles) and leaf growth rate (solid circles) to leaf water potential in three species: (a) maize, (b) soya bean and (c) sunflower. Redrawn from Boyer (1970).
Figure 6
Figure 6
The relationship between volumetric soil water content and fruit cell turgor for tomato plants subjected to regulated deficit irrigation (closed triangles) and partial root zone drying (open circles). Points are means of 3±s.e. Adapted from Mingo et al. (2003).
Figure 7
Figure 7
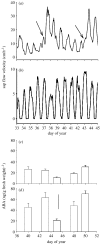
(a) Sap flow velocity in roots of Valencia orange on the (a) irrigated side of trees (arrows show times when irrigation occurred) and (b) non-irrigated side of trees. Abscisic acid (ABA) concentration in the roots (c) of control (both sides irrigated) Valencia orange trees and (d) from the non-irrigated side of PRD Valencia orange trees. Bar represents least significant difference (p=0.05), n=4. Adapted from Loveys et al. (2004) .

References

    1. Alonso-Blanco C, Koornneef M. Naturally occurring variation in Arabidopsis: an underexploited resource for plant genetics. Trends Plant Sci. 2000;5:22–29. doi:10.1016/S1360-1385(99)01510-1 - DOI - PubMed
    1. Araus J.L. The problems of sustainable water use in the Mediterranean and research requirements agriculture. Ann. Appl. Biol. 2004;144:259–272. doi:10.1111/j.1744-7348.2004.tb00342.x - DOI
    1. Bacon M.A. Water use efficiency in plant biology. Blackwell Publishing; Oxford, UK: 2004. p. 327.
    1. Baker N.R, Oxborough K. Chlorophyll fluorescence as a probe of photosynthetic productivity. In: Papageorgiou G.C, Govindjee , editors. Chlorophyll a fluorescence: a signature of photosynthesis. Springer; Dordrecht, The Netherelands: 2004. pp. 65–82.
    1. Baker N.R, Rosenqvist E. Applications of chlorophyll fluorescence can improve crop production strategies: an examination of future possibilities. J. Exp. Bot. 2004;55:1607–1621. doi:10.1093/jxb/erh196 - DOI - PubMed

LinkOut - more resources