

Chronic exposure to 12-O-tetradecanoylphorbol-13-acetate represses sod2 induction in vivo: the negative role of p50
- PMID: 17652337
- PMCID: PMC2656647
- DOI: 10.1093/carcin/bgm163
Chronic exposure to 12-O-tetradecanoylphorbol-13-acetate represses sod2 induction in vivo: the negative role of p50
Abstract
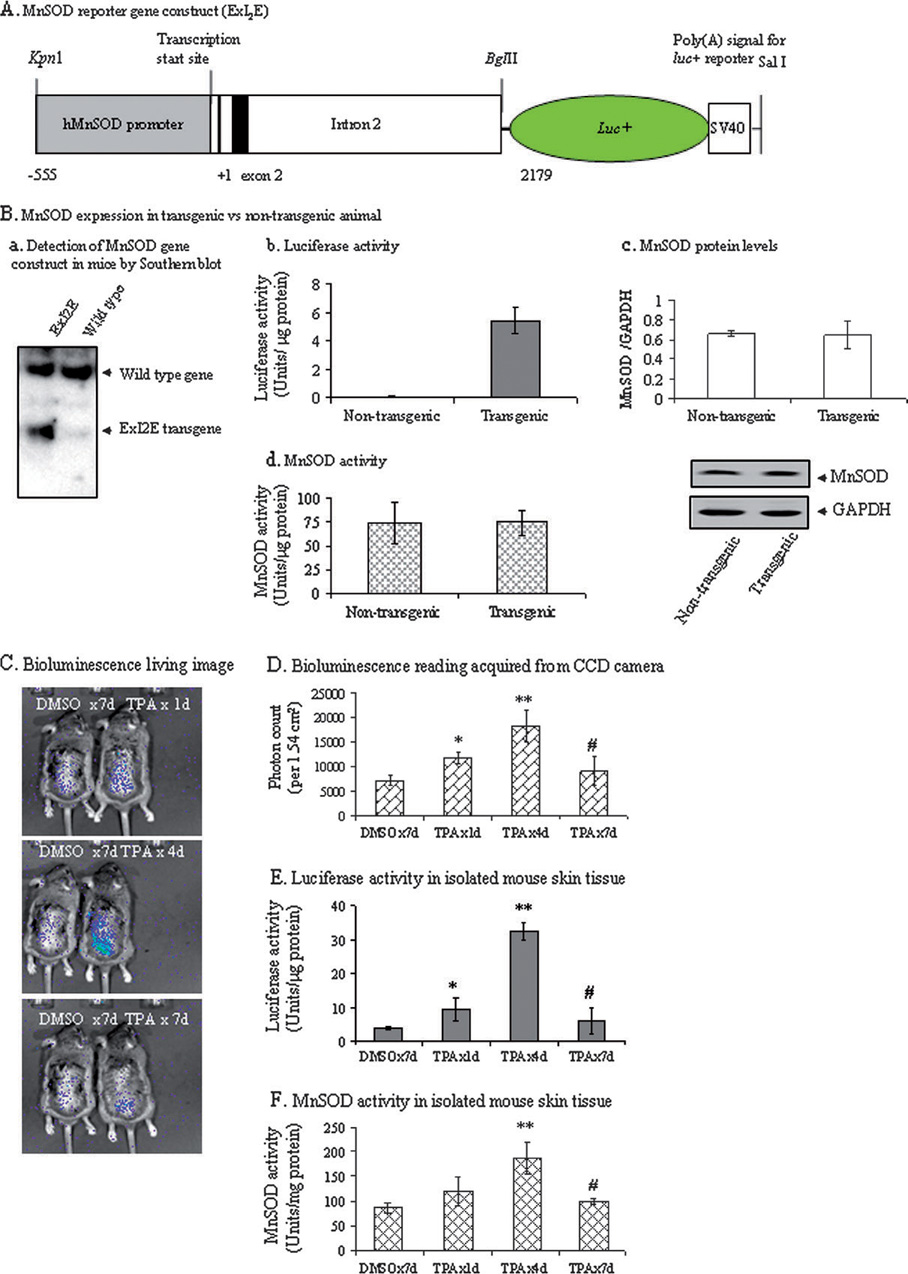
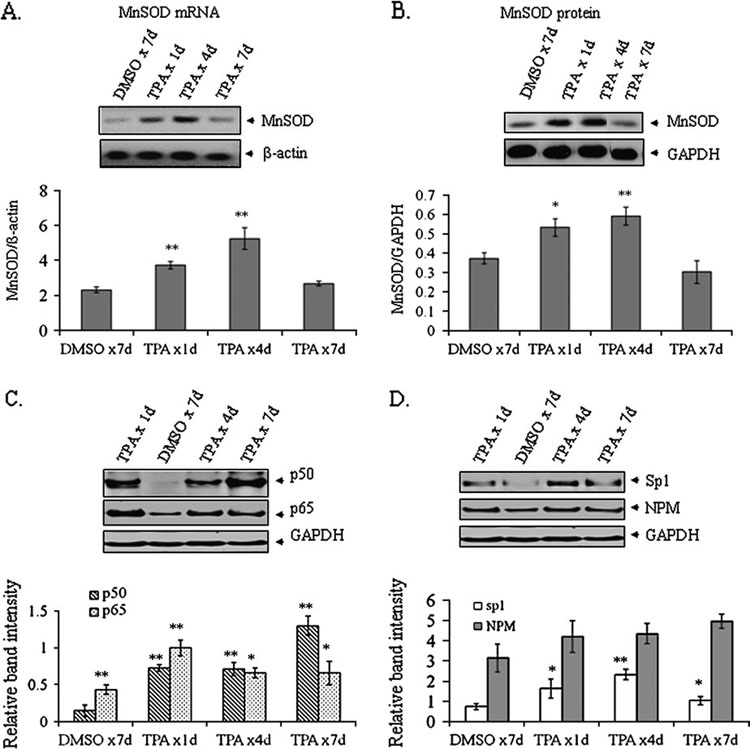
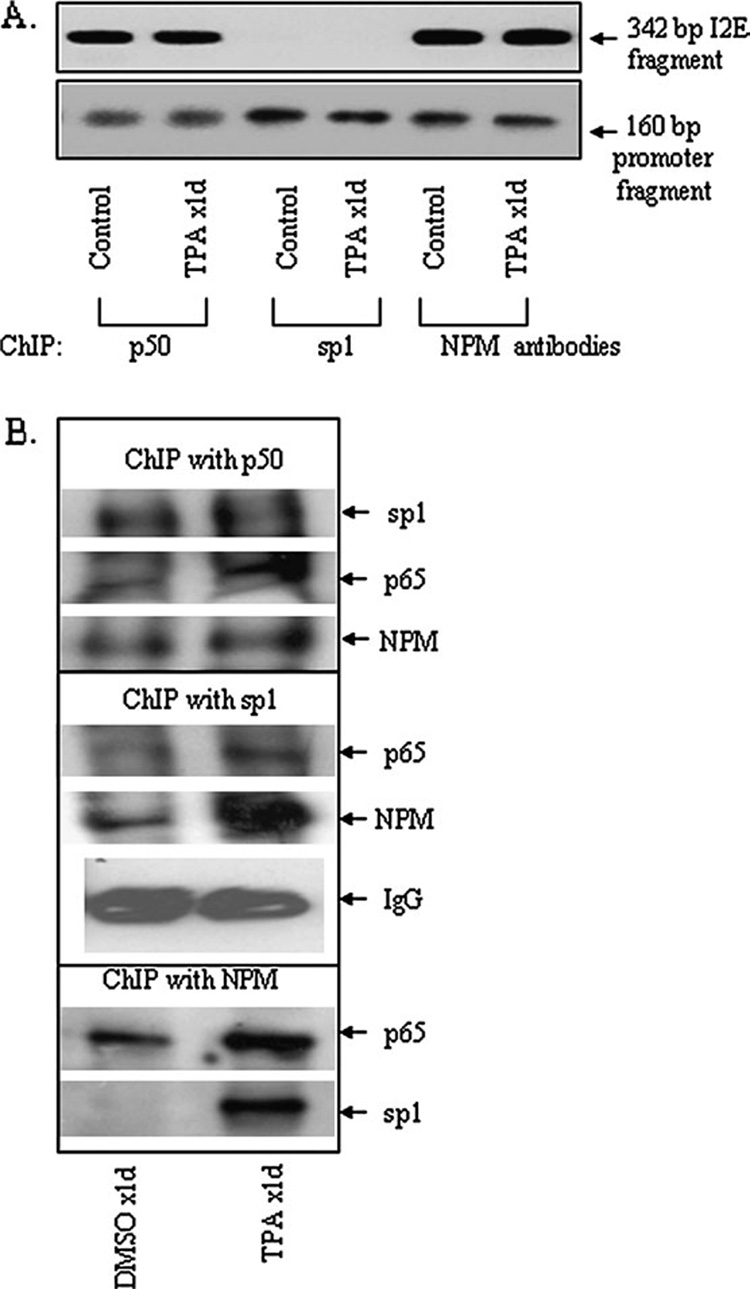
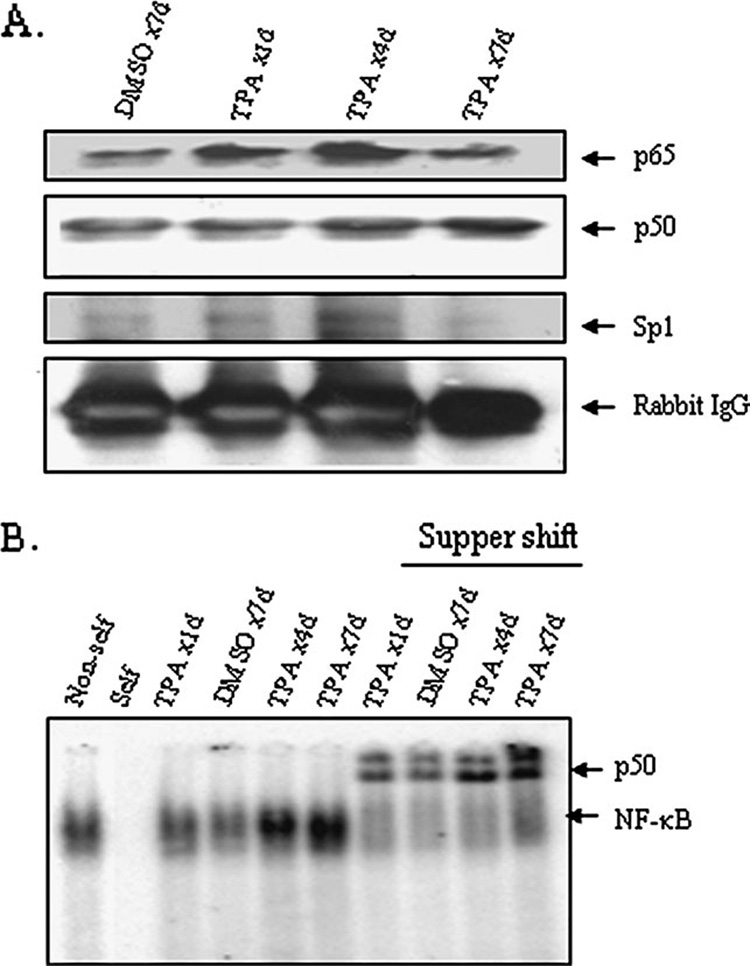
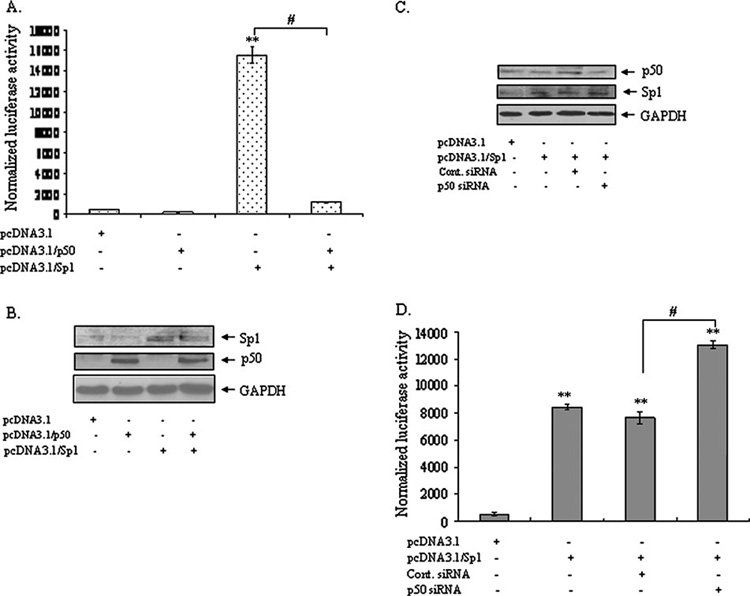
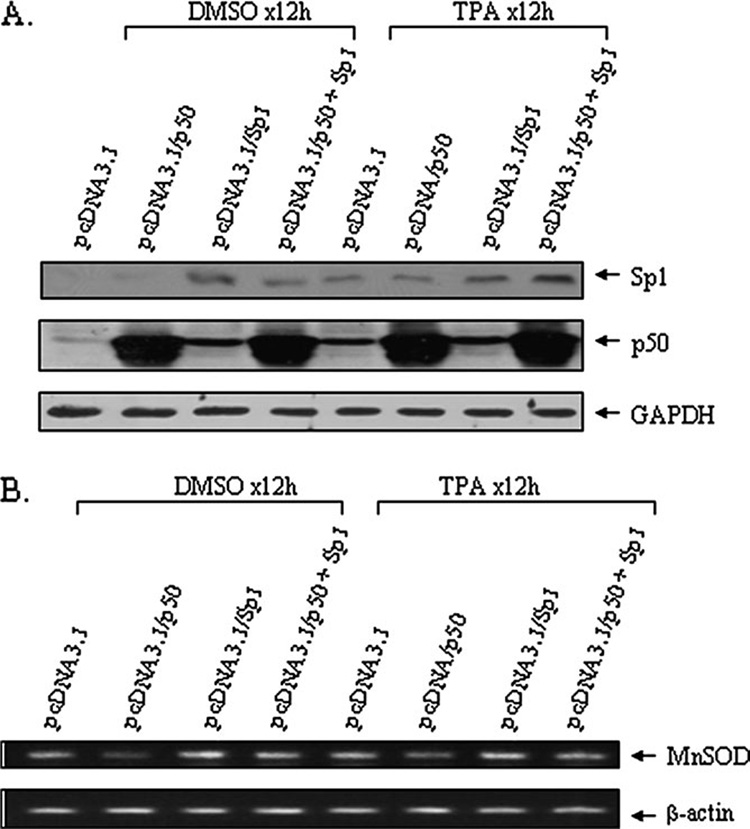
It is well documented that the tumor promoter 12-O-tetradecanoylphorbol-13-acetate (TPA) can activate manganese superoxide dismutase (MnSOD) expression. However, it is unclear how repeated exposure to TPA following a single application of tumor initiator 7,12-dimethylbenz-(a)-anthracene causes tumor development. We generated transgenic mice expressing human MnSOD promoter- and enhancer-driven luciferase reporter gene and used a non-invasive imaging system to investigate the effects of TPA on MnSOD expression in vivo. Our data indicate that TPA initially activates MnSOD expression, but this positive effect declines after repeated applications. Changes in MnSOD expression in vivo were verified by measuring MnSOD mRNA and protein levels. Using chromatin immunoprecipitation coupled to Western analysis of the transcription factors known to be essential for the constitutive and TPA-induced transcription of MnSOD, we found that TPA treatment leads to both activation and inactivation of MnSOD gene transcription. During the activation phase, the levels of p50, p65, specificity protein 1 (Sp1) and nucleophosmin (NPM) increase after TPA treatments. Sustained treatments with TPA lead to further increase of p50 but not p65, Sp1 or NPM, suggesting that excess p50 may have inhibitory effects leading to the suppression of MnSOD. Alteration of p50 levels by expressing p50 cDNA or p50 small interfering RNA in mouse epithelial (JB6) cells confirms that p50 is inhibitory to MnSOD transcription. These findings identify p50 as having a negative effect on MnSOD induction upon repeated applications of TPA and provide an insight into a cause for the reduction of MnSOD expression during early stages of skin carcinogenesis.
Conflict of interest statement
Figures
Similar articles
-
Manganese superoxide dismutase is a p53-regulated gene that switches cancers between early and advanced stages.Cancer Res. 2011 Nov 1;71(21):6684-95. doi: 10.1158/0008-5472.CAN-11-1233. Epub 2011 Oct 18. Cancer Res. 2011. PMID: 22009531 Free PMC article.
-
Specificity protein 1-dependent p53-mediated suppression of human manganese superoxide dismutase gene expression.J Biol Chem. 2006 Aug 4;281(31):21698-21709. doi: 10.1074/jbc.M601083200. Epub 2006 Jun 1. J Biol Chem. 2006. PMID: 16740634 Free PMC article.
-
Identification of nucleophosmin as an NF-kappaB co-activator for the induction of the human SOD2 gene.J Biol Chem. 2004 Jul 2;279(27):28209-19. doi: 10.1074/jbc.M403553200. Epub 2004 Apr 15. J Biol Chem. 2004. PMID: 15087454 Free PMC article.
-
Manganese superoxide dismutase: beyond life and death.Amino Acids. 2012 Jan;42(1):139-58. doi: 10.1007/s00726-010-0600-9. Epub 2010 May 8. Amino Acids. 2012. PMID: 20454814 Free PMC article. Review.
-
Modulation of skin tumorigenesis by SOD.Biomed Pharmacother. 2005 May;59(4):209-14. doi: 10.1016/j.biopha.2005.03.004. Epub 2005 Mar 17. Biomed Pharmacother. 2005. PMID: 15862717 Review.
Cited by
-
Manganese superoxide dismutase is a p53-regulated gene that switches cancers between early and advanced stages.Cancer Res. 2011 Nov 1;71(21):6684-95. doi: 10.1158/0008-5472.CAN-11-1233. Epub 2011 Oct 18. Cancer Res. 2011. PMID: 22009531 Free PMC article.
-
Epigenetic changes in mitochondrial superoxide dismutase in the retina and the development of diabetic retinopathy.Diabetes. 2011 Apr;60(4):1304-13. doi: 10.2337/db10-0133. Epub 2011 Feb 25. Diabetes. 2011. PMID: 21357467 Free PMC article.
-
Diet phytochemicals and cutaneous carcinoma chemoprevention: A review.Pharmacol Res. 2017 May;119:327-346. doi: 10.1016/j.phrs.2017.02.021. Epub 2017 Feb 24. Pharmacol Res. 2017. PMID: 28242334 Free PMC article. Review.
-
Epigenetic modification of Sod2 in the development of diabetic retinopathy and in the metabolic memory: role of histone methylation.Invest Ophthalmol Vis Sci. 2013 Jan 14;54(1):244-50. doi: 10.1167/iovs.12-10854. Invest Ophthalmol Vis Sci. 2013. PMID: 23221071 Free PMC article.
-
FUsed in sarcoma is a novel regulator of manganese superoxide dismutase gene transcription.Antioxid Redox Signal. 2014 Apr 1;20(10):1550-66. doi: 10.1089/ars.2012.4984. Epub 2013 Sep 20. Antioxid Redox Signal. 2014. PMID: 23834335 Free PMC article.
References
-
- Dougall WC, et al. Manganese superoxide dismutase: a hepatic acute phase protein regulated by interleukin-6 and glucocorticoids. Endocrinology. 1991;129:2376–2384. - PubMed
-
- Suzuki K, et al. Manganese superoxide dismutase in endothelial cells: localization and mechanism of induction. Am. J. Physiol. 1993;265:H1173–H1178. - PubMed
-
- Wan XS, et al. Molecular structure and organization of the human manganese superoxide dismutase gene. DNA Cell Biol. 1994;13:1127–1136. - PubMed
-
- Meyrick B, et al. Identification and functional characterization of the bovine manganous superoxide dismutase promoter. Am. J. Respir. Cell Mol. Biol. 1994;10:113–121. - PubMed
Publication types
MeSH terms
Substances
Grants and funding
LinkOut - more resources
Full Text Sources
Medical
Molecular Biology Databases
Research Materials
