. 2007 Sep;134(17):3055-64.
doi: 10.1242/dev.010447. Epub 2007 Jul 25.

The planar polarity pathway promotes coordinated cell migration during Drosophila oogenesis

Affiliations

The planar polarity pathway promotes coordinated cell migration during Drosophila oogenesis

Rebecca Bastock et al. Development. 2007 Sep.

Abstract

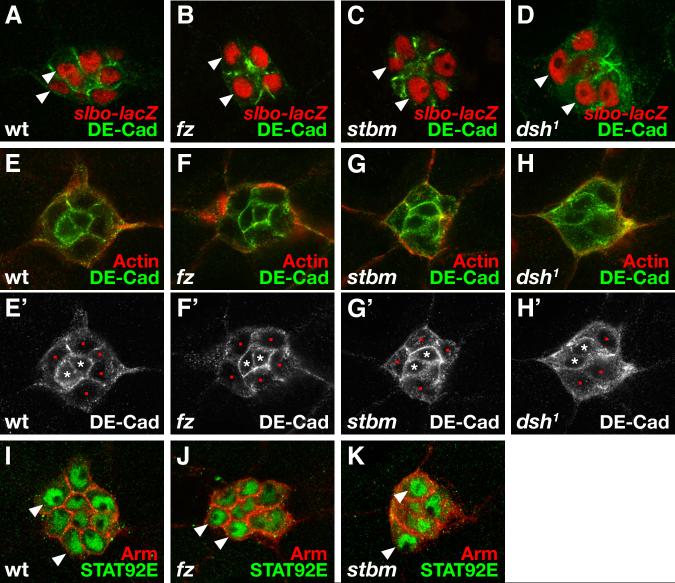
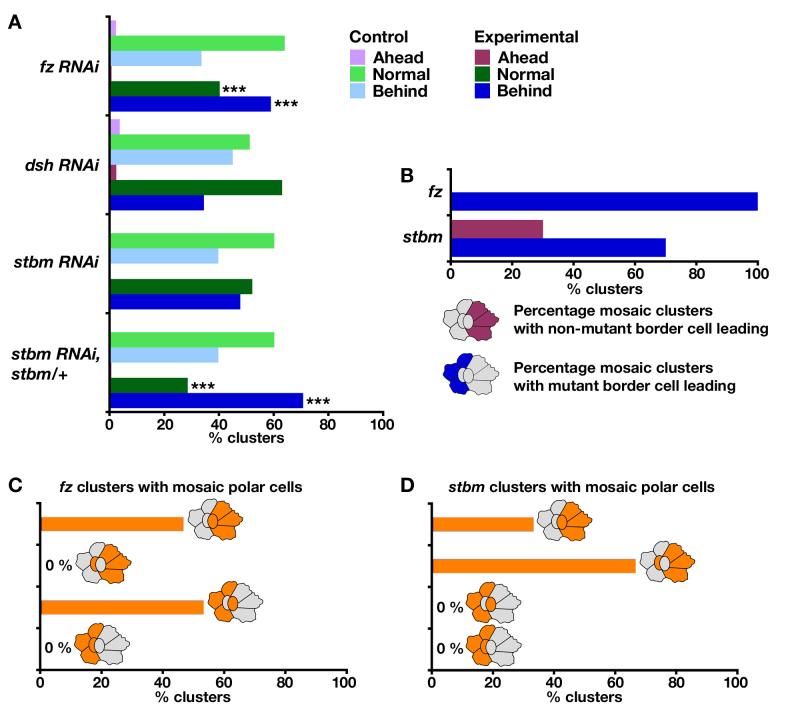
Cell migration is fundamental in both animal morphogenesis and disease. The migration of individual cells is relatively well-studied; however, in vivo, cells often remain joined by cell-cell junctions and migrate in cohesive groups. How such groups of cells coordinate their migration is poorly understood. The planar polarity pathway coordinates the polarity of non-migrating cells in epithelial sheets and is required for cell rearrangements during vertebrate morphogenesis. It is therefore a good candidate to play a role in the collective migration of groups of cells. Drosophila border cell migration is a well-characterised and genetically tractable model of collective cell migration, during which a group of about six to ten epithelial cells detaches from the anterior end of the developing egg chamber and migrates invasively towards the oocyte. We find that the planar polarity pathway promotes this invasive migration, acting both in the migrating cells themselves and in the non-migratory polar follicle cells that they carry along. Disruption of planar polarity signalling causes abnormalities in actin-rich processes on the cell surface and leads to less-efficient migration. This is apparently due, in part, to a loss of regulation of Rho GTPase activity by the planar polarity receptor Frizzled, which itself becomes localised to the migratory edge of the border cells. We conclude that, during collective cell migration, the planar polarity pathway can mediate communication between motile and non-motile cells, which enhances the efficiency of migration via the modulation of actin dynamics.


Figures

Figure 1
Figure 1. Core planar polarity gene function is required in the border cells
Anterior is to the left and border cells are migrating towards the right, in this and subsequent figures. Statistical significances are indicated on charts as *** = p < 0.001, ** = p < 0.01, all p values and numbers of clusters examined are shown in Supplementary Table 1 for UAS/GAL4 experiments and Supplementary Table 2 for mosaic cluster analysis. (A) Schematic of border cell migration and outer follicle cell rearrangement. Anterior polar follicle cells (red) recruit adjacent outer follicle cells (pale green) to form the border cells (dark green). The border cell cluster delaminates from the follicular epithelium and begins to migrate posteriorly at the beginning of Stage 9, normally completing its journey by the end of Stage 9. Concomitantly the outer follicle cells rearrange so that they no longer cover the nurse cells. In wildtype chambers, the border cell cluster migrates at such a rate that it approximately keeps up with the posterior movement of the outer follicle cells. (B, C) Charts showing the extent of border cell migration relative to outer follicle cell rearrangement for clusters in which either fz, dsh or stbm transcripts have been knocked down by UAS-RNAi constructs at 29°C (B) or overexpressed using UAS constructs at 25°C (C) under control of the border cell specific slbo-GAL4 driver (Rørth et al., 1998). Coloured bars indicate proportion of clusters found ahead of the outer follicle cells, in approximately the same position (“normal”) or lagging behind, for either sibling controls or experimental conditions. “Ahead” or “behind” is defined as being more than the diameter of a nurse cell nucleus away from the trailing edge of the rearranging outer follicle cells. Either knockdown of fz, dsh or stbm or overexpression of fz or stbm causes a significant increase in the number of clusters “behind” and an accompanying decrease in the number of clusters showing a “normal” rate of migration. (D) Chart showing the proportions of genetically mosaic clusters recovered for the strong alleles fz15 and stbm6 with both polar follicle cells retaining gene function, but either wildtype border cells leading (purple bars) or mutant border cells leading (blue bars). In both genotypes, there is a statistically significant (p = 0.003) preponderance for wildtype border cells to be found at the leading edge of the migrating cluster. Mutant cells in cartoons represented by grey shading, leading cells to the right and lagging cells to the left.
Figure 2
Figure 2. Border cell clusters lacking core planar polarity gene function show normal expression of slow border cells, DE-Cadherin and STAT92E
(A-D) slow border cells expression as revealed by the slbo-lacZ reporter (Montell et al., 1992) and β-gal immunolabelling (red) and DE-Cadherin (DE-Cad, green) expression in migrating border cell clusters from wildtype (A), fz21/fz15 (B), stbm6 (C) and dsh1 (D) individuals. High levels of nuclear localised lacZ gene product in border cells indicated by arrowheads. We observe that in wildtype clusters β-gal levels were lower at early Stage 9 than at the end of Stage 9, whereas in mutant clusters β-gal levels were generally higher throughout migration. We assume that β-gal accumulates progressively within the border cells after the onset of gene expression, and that the delayed migration seen in the mutant backgrounds results in higher accumulation at equivalent stages of migration. (E-H, E’-H’) DE-Cad (green and white) and actin (red) distribution in migrating border cell clusters from wildtype (E, E’), fz21 (F, F’), stbm6 (G, G’) and dsh1 (H, H’) individuals. Border cells marked by red dots and polar follicle cells by white asterisks. (I-K) STAT92E (green) and Armadillo (Arm, red) distribution in migrating border cell clusters from wildtype (I), fz21 (J) and stbm6 (K) individuals. High levels of nuclear localised STAT92E in border cells indicated by arrowheads.
Figure 3
Figure 3. Core planar polarity genes regulate the border cell actin cytoskeleton
Polar follicle cells marked with white asterisks and border cells marked with red dots. (A-G) Migrating border cell clusters, fixed to enhance preservation of actin structures (see Experimental Procedures). In wildtype clusters (A) large actin-rich protrusions can be seen (arrowheads). In fz15/fz23 (B), dsh1 (C), stbm6 (D) and slbo-GAL4/UAS-fz-RNAi (E), the cytoskeleton appears fuzzy and large protrusions are rarely seen. Overexpression of fz (F) and stbm (G) under control of slbo-GAL4 also disrupts formation of large actin-rich protrusion. GAL4 experiments carried out at 29°C. (H-L) Migrating border cell clusters stained for actin (red or white), expressing slbo-Gal4, UAS-GFP (green) at 25°C. Co-expression of dominant negative RhoN19 (H), RhoN19 and fz-RNAi (I), fz-RNAi (J), dominant active RhoV14 (K), RhoV14 and fz-RNAi (L). The UAS-fz-RNAi insertion used was chosen as it gives weaker phenotypes than the insertion used for other experiments (e.g. panels E and N), with some actin-rich protrusions still visible (J). Expressing dominant negative RhoN19 results in border cells becoming long and thin and not migrating effectively (H) and co-expressing fz-RNAi has no effect on this phenotype (I). Cells expressing dominant active RhoV14 become very round with an even cytoskeleton (K) and co-expressing fz-RNAi (L) ameliorates this phenotype with the cells appearing less round and producing actin-rich protrusions (arrowheads). (M,N) Migrating border cell clusters, stained for actin (red), expressing GFP-RhoA (green or white). In wildtype clusters GFP-RhoA colocalises with actin-rich protrusions at the cell surface (M), which are lost in cells expressing fz-RNAi under control of slbo-GAL4 at 25°C (N), resulting in a partial redistribution of GFP-RhoA to the cytoplasm. Border cell clusters expressing fz-RNAi under the control of slbo-GAL4 showed an average cytoplasmic level of GFP-RhoA of 24.0% of peak membrane levels (n=10), compared to 15.4% for control clusters lacking the slbo-GAL4 driver (n=9), these results being statistically significant at the p<10-5 level (t-test).
Figure 4
Figure 4. Core polarity gene function in the polar follicle cells affects border cell migration
(A) Chart showing extent of border cell migration for clusters in which either fz, dsh or stbm transcripts have been knocked down by UAS-RNAi constructs under control of the polar follicle cell specific upd-GAL4 driver at 29°C (Tsai and Sun, 2004). Knockdown of fz transcripts causes a significant increase in the number of clusters “behind”, whereas knockdown of dsh causes no delay in migration. Knockdown of stbm in flies carrying two copies of the endogenous stbm locus causes a mild delay in border cell migration, which is greatly enhanced by removal of one copy of the endogenous locus. (B) Chart showing the proportions of genetically mosaic clusters recovered for the strong alleles fz15 and stbm6 with both polar follicle cells lacking gene function, and either wildtype border cells leading (purple bars) or mutant border cells leading (blue bars). Mutant cells in cartoons represented by grey shading, leading cells to the right and lagging cells to the left. In the small number of fz mosaic clusters recovered (n = 6) we saw no clusters with a wildtype border cell leading, which only deviates from the null hypothesis that border cell position is random at a significance level of p = 0.034. In the stbm mosaic clusters recovered (n = 10), both wildtype and mutant border cells are seen leading, and the result fits the null hypothesis that border cell position is random (p = 0.5). (C) Chart showing the proportions of genetically mosaic clusters recovered for the strong fz15 allele with only one polar follicle cell lacking gene function. Two classes of clusters were recovered (n = 15), both had the non-mutant polar follicle cell touching the leading border cell, with the genotype of this leading border cell approximately equally distributed between wildtype and mutant. The leading position of the polar follicle cells strongly deviates from the null hypothesis that polar cell position is random (p = 0.0003), whereas the position of the border cells fits the hypothesis that this is random with respect to the genotype of the border cell (p = 0.71). The data suggest that border cell position is determined by the genotype of the polar follicle cell with which they make junctional contact, regardless of the genotype of the border cell. (D) Chart showing the proportions of genetically mosaic clusters recovered for the strong stbm6 allele with only one polar follicle cell lacking gene function. Two classes of clusters were recovered (n = 9), both had non-mutant border cells leading the cluster, with the genotype of the polar follicle cell touching the leading border cell being either mutant or non-mutant. The leading position of wildtype border cells does not fit the null hypothesis that position is random (p = 0.018). The position of the wildtype polar cells fits the hypothesis that this is randomly determined (p = 0.51).
Figure 5
Figure 5. Fz and Stbm proteins are localised within the border cell cluster
Illustrations show border cells (white), polar follicle cells (grey) and Fz (red), direction of migration is towards the right (grey arrows). (A-D) Border cell clusters stained for Fz (red) and actin (green). Fz is in the adherens junctions of the polar follicle cells (A) and apical regions of the border cells (B) prior to migration. During migration Fz localisation is retained in the junctional region that the polar follicle cells share with the border cells (C) and is within the migratory regions of the border cells (D). This pattern of localisation is lost in egg-chambers mutant for fz, consistent with the immunolabelling being specific (data not shown). (E,G) Egg chambers stained for Armadillo or Actin (red), Stbm (green). Stbm is localised to the polar follicle cell adherens junctions (arrow). This pattern of localisation is lost in egg-chambers mutant for stbm (data not shown). (F,H) Egg chambers stained for Armadillo or Actin (red), Dsh-GFP (green). Dsh-GFP is seen in a punctate pattern in polar follicle cell and border cell cytoplasm, and also partially overlaps the adherens junction region (arrow).
Figure 6
Figure 6. Model of Fz and Stbm interactions in the pupal wing epithelium and border cell cluster
In the wing, Fz and Stbm mutually reinforce each others’ localisation in opposing junctions of neighbouring cells (curly black arrows) and inhibit each others’ localisation in adjacent regions of the same cell (grey bars). Distally localised Fz within the same cell promotes production of a single distal actin rich trichome, via Dsh and RhoA (Axelrod, 2001; Strutt, 2001; Strutt et al., 1997). In addition, proximally localised Stbm is thought to promote trichome formation at the opposite end by an uncharacterised mechanism (Adler et al., 2004). In the border cell cluster, Fz and Stbm are localised to the junctional regions where the epithelial polar follicle cells and the partly epithelial border cells contact. As Fz expressing polar follicle cells promote migration of Stbm expressing border cells in a contact dependent manner, we infer that Fz in the junctions of polar cells promotes the localisation of Stbm to the junctions of border cells. In turn this would lead to Fz localisation to the non-junctional (mesenchymal) migratory regions of the border cells. Fz in border cells locally modulates formation of appropriate actin structures, probably via Dsh and RhoA as in the wing. In addition, Stbm in the junctions of border cells promotes formation of actin structures at a distance in the migratory region. In this way, Stbm localised to junctions and Fz in the migratory region both independently promote migration. Consistent with our mosaic analysis, this scheme predicts that (i) contact with a Fz-expressing polar cell promotes border cell migration (Fig.4B,C), (ii) Fz expressing polar cells are only able to promote migration of border cells that express Stbm (Fig.1D, 4D), (iii) Stbm is required in the polar cells for efficient border cell migration (Fig.4B), but the border cells do not need to touch the Stbm-expressing polar cell (Fig.4D).

References

    1. Adler PN, Zhu C, Stone D. Inturned localizes to the proximal side of wing cells under the instruction of upstream planar polarity proteins. Curr. Biol. 2004;14:2046–2051. - PubMed
    1. Axelrod JD. Unipolar membrane association of Dishevelled mediates Frizzled planar cell polarity signalling. Genes Dev. 2001;15:1182–1187. - PMC - PubMed
    1. Bastock R, Strutt H, Strutt D. Strabismus is asymmetrically localised and binds to Prickle and Dishevelled during Drosophila planar polarity patterning. Development. 2003;130:3007–3014. - PubMed
    1. Brand AH, Perrimon N. Targeted gene expression as a means of altering cell fates and generating dominant phenotypes. Development. 1993;118:401–415. - PubMed
    1. Chen X, Oh SW, Zheng Z, Chen HW, Shin HH, Hou SX. Cyclin D-Cdk4 and cyclin E-Cdk2 regulate the Jak/STAT signal transduction pathway in Drosophila. Dev. Cell. 2003;4:179–190. - PubMed

Publication types

MeSH terms