. 2007 Oct;18(10):3860-72.
doi: 10.1091/mbc.e07-01-0075. Epub 2007 Jul 25.

The Abl-related gene tyrosine kinase acts through p190RhoGAP to inhibit actomyosin contractility and regulate focal adhesion dynamics upon adhesion to fibronectin

Affiliations

The Abl-related gene tyrosine kinase acts through p190RhoGAP to inhibit actomyosin contractility and regulate focal adhesion dynamics upon adhesion to fibronectin

Justin G Peacock et al. Mol Biol Cell. 2007 Oct.

Abstract

In migrating cells, actin polymerization promotes protrusion of the leading edge, whereas actomyosin contractility powers net cell body translocation. Although they promote F-actin-dependent protrusions of the cell periphery upon adhesion to fibronectin (FN), Abl family kinases inhibit cell migration on FN. We provide evidence here that the Abl-related gene (Arg/Abl2) kinase inhibits fibroblast migration by attenuating actomyosin contractility and regulating focal adhesion dynamics. arg-/- fibroblasts migrate at faster average speeds than wild-type (wt) cells, whereas Arg re-expression in these cells slows migration. Surprisingly, the faster migrating arg-/- fibroblasts have more prominent F-actin stress fibers and focal adhesions and exhibit increased actomyosin contractility relative to wt cells. Interestingly, Arg requires distinct functional domains to inhibit focal adhesions and actomyosin contractility. The kinase domain-containing Arg N-terminal half can act through the RhoA inhibitor p190RhoGAP to attenuate stress fiber formation and cell contractility. However, Arg requires both its kinase activity and its cytoskeleton-binding C-terminal half to fully inhibit focal adhesions. Although focal adhesions do not turn over efficiently in the trailing edge of arg-/- cells, the increased contractility of arg-/- cells tears the adhesions from the substrate, allowing for the faster migration observed in these cells. Together, our data strongly suggest that Arg inhibits cell migration by restricting actomyosin contractility and regulating its coupling to the substrate through focal adhesions.


Figures
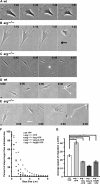
Figure 1.
Figure 1.
Arg inhibits cell migration on FN. (A–C) Individual frames from time-lapse movies of wt (A; see Supplementary Video SV3) or arg−/− (B and C; see Supplementary Videos SV4 and SV5) cells migrating on coverslips coated with 1 μg/ml FN. Elapsed time, hour:minute. arg−/− cells migrate in “snaps” as they suddenly detach and lurch forward. The arrow in B indicates the location of the arg−/− cell's trailing edge in the previous time-lapse image. Note the large distance traveled by the arg−/− cell during this time period. The asterisk in C indicates where the arg−/− cell tore apart during the preceding interval. (D and E) Individual frames from time-lapse movies of wt (D; see Supplementary Information, Supplementary Video SV3) or arg−/− (E; see Supplementary Information, Supplementary Video SV4) cells migrating on coverslips coated with 1 μg/ml FN. Elapsed time, hour:minute. The white lines indicate the migration paths of the cells, with a star indicating the start of the path and the arrowhead representing the end of the path. Note the larger distance traveled by the arg−/− cell compared with the wt cell during the same time period. The arrow in B indicates arg−/− cell fragment remaining after the cell “snapped” forward. Bar, (A–E) 20 μm (bottom left corner). (F) Plot of distribution of migration step sizes per 3-min interval in wt + YFP, arg−/− + YFP, arg−/− + Arg-YFP, arg−/− + ArgΔC-YFP, and arg−/− + ArgKI-YFP cells. Note the increased frequency of large migration steps in arg−/− + YFP cells. wt + YFP, n = 18 cells; arg−/− + YFP, n = 21 cells; arg−/− + Arg-YFP, n = 22 cells; arg−/− + ArgΔC-YFP, n = 20 cells; and arg−/− + ArgKI-YFP, n = 23 cells. Parametric ANOVA between data for all cell types, p < 0.0001. All pairwise comparisons except for arg−/− + Arg-YFP versus arg−/− + ArgKI-YFP are significantly different from each other by post hoc Student-Newman-Keuls test (p < 0.05). (G) The average migration speed of wt + YFP, arg−/− + YFP, arg−/− + Arg-YFP, arg−/− + ArgΔC-YFP, and arg−/− + ArgKI-YFP cells on FN coverslips was monitored over 7 h. wt + YFP, n = 18 cells; arg−/− + YFP, n = 21 cells; arg−/− + Arg-YFP, n = 22 cells, arg−/− + ArgΔC-YFP, n = 20 cells; and arg−/− + ArgKI-YFP, n = 23 cells. ANOVA between data for all cell types, p < 0.0001. *post hoc Student-Newman-Keuls, p < 0.05.
Figure 2.
Figure 2.
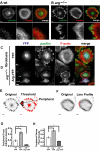
Arg expression inhibits FAs and stress fibers. (A and B) wt (A) or arg−/− (B) fibroblasts were plated on FN-coated coverslips, fixed, and stained with Alexa350-phalloidin to visualize F-actin and with anti-paxillin antibodies to visualize focal adhesions (FAs). Top row images were obtained with a 40× objective lens, and bottom row images were obtained with a 100× objective lens and are magnified images of the top row's boxed regions. Merged image (merge) shows F-actin (red) and paxillin (green). Bar, 10 μm. (C and D) arg−/− + YFP (C) or arg−/− + Arg-YFP (D) fibroblasts were plated on FN-coated coverslips, fixed, and stained with Alexa350-phalloidin to visualize F-actin and with anti-paxillin antibodies to visualize FAs. In D, arg−/− cells expressing no (*), low (**), or high (***) levels of Arg-YFP are indicated on the YFP channel to the far left. Images were obtained with a 20× objective lens. Merged image (merge) shows F-actin (red) and paxillin (green). Bar, 10 μm. (E) Example FA quantitation diagram of arg−/− cell from B. The original illustrates an inverted image of focal adhesion staining. Peripheral FA density was determined in areas that protrude from the cell body in threshold-adjusted images (see highlighted area in Threshold image). For E and F, see Materials and Methods for details. (F) Example stress fiber quantitation diagram of arg−/− cell from B. The original illustrates an inverted F-actin–staining image. Lines were drawn perpendicular to the stress fiber orientation, and plot profile measurements allowed for determination of stress fiber densities (see Line Profile image). (G and H) Quantitation of peripheral FA density (G) and peripheral stress fiber density (H) in wt + YFP, arg−/− + YFP and arg−/− + Arg-YFP cells. Mean ± SE; n = 20 cells for all genotypes. ANOVA between data for all genotypic classes (G and H) p < 0.0001. *post hoc Student-Newman-Keuls, p < 0.05.
Figure 3.
Figure 3.
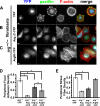
Arg regulates focal adhesions and stress fibers via distinct domains. (A–C) arg−/− fibroblasts expressing YFP (A), ArgΔC-YFP (B), or ArgKI-YFP (C) were plated on FN-coated coverslips and fixed and stained for F-actin and paxillin. Images were obtained with a 20× objective lens. Merged image (merge) shows YFP (blue), F-actin (red), and paxillin (green). Bar, 10 μm. (D and E) Peripheral FA and stress fiber density quantitation in arg−/− cells + Arg- or Arg mutant-YFP. Mean ± SE; 20 cells were analyzed for each genotype and both quantitations. ANOVA between data for all genotypes, p < 0.0001; *post hoc Student-Newman-Keuls, p < 0.05.
Figure 4.
Figure 4.
Arg inhibits stress fibers through p190RhoGAP. (A and B) Arg kinase activity is required for adhesion-dependent Rho inhibition. (A) Relative Rho activity plotted as a function of time. Rho activity was assessed in wt (blue diamonds), arg−/− + YFP (red squares), arg−/− + ArgΔC-YFP (green triangles), and arg−/− + ArgKI-YFP (purple ×) cells in suspension (0 min) or plated on FN for 10, 20, 30, or 60 min. Relative Rho activity indicates Rho activity at each time point normalized to the zero time point for each cell type. Mean ± SE; n ≥ 3. Analysis of variance between all cell types: 10-min time point, p = 0.0008; 20-min time point, p = 0.0498; 30-min time point, p = 0.0020; and 60-min time point, p = 0.1283. The following are significantly different as indicated by pairwise post hoc Fisher's PLSD test (*p < 0.05): 10 min, WT and YFP, WT and ArgKI-YFP, YFP and ArgΔC-YFP, ArgΔC-YFP and ArgKI-YFP; 20 min, WT and YFP, WT and ArgKI-YFP, ArgΔC-YFP and ArgKI-YFP; 30 min, WT and YFP, WT and ArgKI-YFP, WT and ArgΔC-YFP; and 60 min, WT and YFP. (B) Total Rho levels were determined for each cell type at each time point to ensure equal loading for the assay; 75 μg of total protein extract was immunoblotted for RhoA. (C–F) p190rhogapa+/+ (p190+/+; C and D) or p190rhogapa−/− (p190−/−; E and F) fibroblasts expressing YFP (C and E) or Arg-YFP (D and F) were plated on FN-coated coverslips and fixed and stained for F-actin and paxillin. Images were obtained with a 20× objective lens. Merged image (merge) shows YFP (blue), F-actin (red), and paxillin (green). Bar, 10 μm. (G and H) Quantitation of peripheral FA and stress fiber density in p190+/+ + YFP or Arg-YFP and p190−/− + YFP or Arg-YFP cells. Mean ± SE. Twenty cells were analyzed for each genotype and both quantitations. ANOVA between data for all genotypes, p < 0.0001. *post hoc Student-Newman-Keuls, p < 0.05.
Figure 5.
Figure 5.
Arg inhibits contractility via p190RhoGAP. (A and B) wt (A) or arg−/− (B) cells were plated on FN-coated coverslips, fixed, and stained with antibodies to phosphoSer19 of myosin light chain (pMLC) and pan-myosin II (MyoII) heavy chain, and Alexa350-phalloidin to visualize F-actin. Top row images were obtained with a 40× objective lens and bottom row images were obtained with a 100× objective lens and are magnified images of the top row's boxed regions. Merged image (merge) shows F-actin (red) and pMLC (green). Bar, 10 μm. (C) Contractility of wt + YFP cells in collagen/FN gels with DMSO (control) or blebbistatin. The percent decrease in gel diameter is shown for each treatment. Mean ± SE; n = 4 experiments; ANOVA between data for both treatments, p = 0.0199. *post hoc Student-Newman-Keuls, p < 0.05. (D) Contractility of wt + YFP and arg−/− + YFP or Arg-YFP cells in collagen/FN gels. The percent decrease in gel diameter is shown for each genotype. Mean ± SE; wt + YFP, n = 9 experiments; arg−/− + YFP, n = 5 experiments; and arg−/− + Arg-YFP, n = 5 experiments; ANOVA between data for all genotypic classes, p < 0.0001. *post hoc Student-Newman-Keuls, p < 0.05. (E) Contractility of arg−/− + YFP, Arg-YFP, ArgΔC-YFP, or ArgKI-YFP cells in collagen/FN gels. The percent decrease in gel diameter is shown for each genotype. Mean ± SE; n = 5 experiments for each genotype. ANOVA between data for all genotypic classes, p < 0.0001. *post hoc Student-Newman-Keuls, p < 0.05. (F) Differential effects of Arg-YFP expression on contractility of p190+/+ or p190−/− cells. Mean ± SE; n = 5 experiments for each genotype. ANOVA between data for all genotypic classes, p = 0.0003. *post hoc Student-Newman-Keuls, p < 0.05.
Figure 6.
Figure 6.
FA dynamics are altered in arg−/− cells. (A–C) Fluorescence images of a time-lapse sequence of paxillin-GFP (A and B) or paxillin-DsRed (C) dynamics in a wt (A; see Supplementary Video SV6), arg−/− (B, Supplementary Video SV7), or arg−/− + ArgKI-YFP (C; Supplementary Video SV8) fibroblast. Images obtained at 1, 14, and 27 min (left panels) were colored red, green, and blue, respectively, and overlaid to form the merge image. Stationary FAs appear as a single color, usually white, whereas FAs that move have a rainbow appearance. Boxed areas in the central merge image are enlarged 400% for the merge and 1-, 14-, and 27-min time-point panels on the right to show FA dynamics in different parts of the fibroblasts. Arrows mark the trailing edge(s) of the cell. The FA in enlargement (1) of the wt cell (A) assembles between the 1- and 14-min time points and disassembles between the 14- and 27-min time points. The FA in enlargement (2) of the wt cell assembles between the 1- and 14-min time points, but does not disassemble. The FAs in arg−/− cells (B) slide, but do not significantly decrease in intensity during filming period. FAs form slowly in arg−/− + ArgKI-YFP cells (C) during the 27-min time period, and once formed, do not change intensity significantly over the time period. The FAs in arg−/− + ArgKI-YFP cells do not slide significantly (white appearance). Note that FAs in wt cells are dimmer than in either arg−/− or arg−/− + ArgKI-YFP cells. Bar, 10 μm. (D and E) Rate constants for FA formation (D) and disassembly (E) for wt, arg−/−, and arg−/− + ArgKI-YFP cells are given. Mean ± SE. Assembly and disassembly rate constants were determined respectively from 21 FAs from five and four wt cells, from 20 FAs each from four arg−/− cells, and from 19 FAs from four arg−/− + ArgKI-YFP cells. For D and E, ANOVA between different cell types, *p = 0.0001. *post hoc Student-Newman-Keuls, p < 0.05.

References

    1. Affolter M., Weijer C. J. Signaling to cytoskeletal dynamics during chemotaxis. Dev. Cell. 2005;9:19–34. - PubMed
    1. Arora P. D., McCulloch C. A. Dependence of collagen remodelling on alpha-smooth muscle actin expression by fibroblasts. J. Cell. Physiol. 1994;159:161–175. - PubMed
    1. Bashaw G. J., Kidd T., Murray D., Pawson T., Goodman C. S. Repulsive axon guidance: Abelson and Enabled play opposing roles downstream of the roundabout receptor. Cell. 2000;101:703–715. - PubMed
    1. Bennett R. L., Hoffmann F. M. Increased levels of the Drosophila Abelson tyrosine kinase in nerves and muscles: subcellular localization and mutant phenotypes imply a role in cell-cell interactions. Development. 1992;116:953–966. - PubMed
    1. Bradley W. D., Hernandez S. E., Settleman J., Koleske A. J. Integrin signaling through Arg activates p190RhoGAP by promoting its binding to p120RasGAP and recruitment to the membrane. Mol. Biol. Cell. 2006;17:4827–4836. - PMC - PubMed

Publication types

MeSH terms

LinkOut - more resources