

Detection of cystic fibrosis transmembrane conductance regulator activity in early-phase clinical trials
- PMID: 17652506
- PMCID: PMC2647604
- DOI: 10.1513/pats.200703-043BR
Detection of cystic fibrosis transmembrane conductance regulator activity in early-phase clinical trials
Abstract
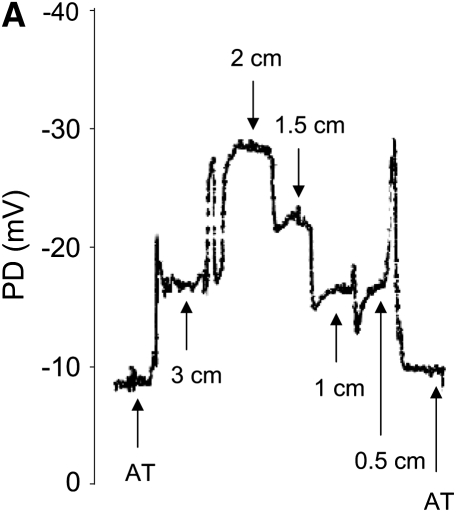
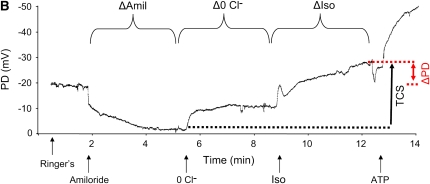
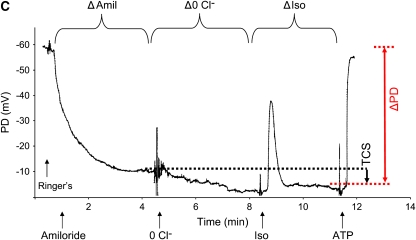
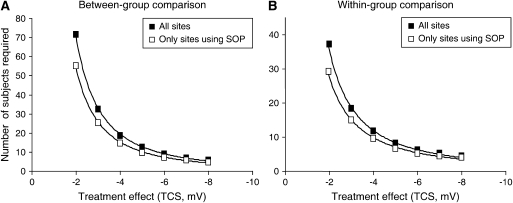
Advances in our understanding of cystic fibrosis pathogenesis have led to strategies directed toward treatment of underlying causes of the disease rather than treatments of disease-related symptoms. To expedite evaluation of these emerging therapies, early-phase clinical trials require extension of in vivo cystic fibrosis transmembrane conductance regulator (CFTR)-detecting assays to multicenter trial formats, including nasal potential difference and sweat chloride measurements. Both of these techniques can be used to fulfill diagnostic criteria for the disease, and can discriminate various levels of CFTR function. Full realization of these assays in multicenter clinical trials requires identification of sources of nonbiological intra- and intersite variability, and careful attention to study design and statistical analysis of study-generated data. In this review, we discuss several issues important to the performance of these assays, including efforts to identify and address aspects that can contribute to inconsistent and/or potentially erroneous results. Adjunctive means of detecting CFTR including mRNA expression, immunocytochemical localization, and other methods are also discussed. Recommendations are presented to advance our understanding of these biomarkers and to improve their capacity to predict cystic fibrosis outcomes.
Figures
Similar articles
-
Assessment of cystic fibrosis transmembrane conductance regulator (CFTR) activity in CFTR-null mice after bone marrow transplantation.Proc Natl Acad Sci U S A. 2006 Feb 21;103(8):2965-70. doi: 10.1073/pnas.0510758103. Epub 2006 Feb 15. Proc Natl Acad Sci U S A. 2006. PMID: 16481627 Free PMC article.
-
Cystic fibrosis transmembrane conductance regulator ion channel function testing in recurrent acute pancreatitis.J Clin Gastroenterol. 2008 Aug;42(7):810-4. doi: 10.1097/MCG.0b013e318156617c. J Clin Gastroenterol. 2008. PMID: 18360295
-
Cystic fibrosis and survival to 40 years: a study of cystic fibrosis transmembrane conductance regulator function.Eur Respir J. 2011 May;37(5):1076-82. doi: 10.1183/09031936.00079010. Epub 2010 Sep 16. Eur Respir J. 2011. PMID: 20847077
-
Biomarkers for cystic fibrosis drug development.J Cyst Fibros. 2016 Nov;15(6):714-723. doi: 10.1016/j.jcf.2016.10.009. Epub 2016 Oct 27. J Cyst Fibros. 2016. PMID: 28215711 Free PMC article. Review.
-
CFTR biomarkers: time for promotion to surrogate end-point.Eur Respir J. 2013 Jan;41(1):203-16. doi: 10.1183/09031936.00057512. Epub 2012 Aug 9. Eur Respir J. 2013. PMID: 22878883 Review.
Cited by
-
Lumacaftor/Ivacaftor in Patients Aged 6-11 Years with Cystic Fibrosis and Homozygous for F508del-CFTR.Am J Respir Crit Care Med. 2017 Apr 1;195(7):912-920. doi: 10.1164/rccm.201608-1754OC. Am J Respir Crit Care Med. 2017. PMID: 27805836 Free PMC article. Clinical Trial.
-
Novel outcome measures for clinical trials in cystic fibrosis.Pediatr Pulmonol. 2015 Mar;50(3):302-315. doi: 10.1002/ppul.23146. Epub 2014 Dec 30. Pediatr Pulmonol. 2015. PMID: 25641878 Free PMC article. Review.
-
An international randomized multicenter comparison of nasal potential difference techniques.Chest. 2010 Oct;138(4):919-28. doi: 10.1378/chest.10-0179. Epub 2010 May 14. Chest. 2010. PMID: 20472865 Free PMC article. Clinical Trial.
-
Correction of the F508del-CFTR protein processing defect in vitro by the investigational drug VX-809.Proc Natl Acad Sci U S A. 2011 Nov 15;108(46):18843-8. doi: 10.1073/pnas.1105787108. Epub 2011 Oct 5. Proc Natl Acad Sci U S A. 2011. PMID: 21976485 Free PMC article.
-
Optical Nanosensors for in vivo Physiological Chloride Detection for Monitoring Cystic Fibrosis Treatment.Anal Methods. 2020 Mar 21;12(11):1441-1448. doi: 10.1039/C9AY02717C. Epub 2020 Feb 26. Anal Methods. 2020. PMID: 32226484 Free PMC article.
References
-
- Rowe SM, Clancy JP. Advances in cystic fibrosis therapies. Curr Opin Pediatr 2006;18:604–613. - PubMed
-
- Knowles M, Gatzy J, Boucher R. Increased bioelectric potential difference across respiratory epithelia in cystic fibrosis. N Engl J Med 1981;305:1489–1495. - PubMed
-
- Schuler D, Sermet-Gaudelus I, Wilschanski M, Ballmann M, Dechaux M, Edelman A, Hug M, Leal T, Lebacq J, Lebecque P, et al. Basic protocol for transepithelial nasal potential difference measurements. J Cyst Fibros 2004;3:151–155. - PubMed
-
- Hentchel-Franks K, Lozano D, Eubanks-Tarn V, Cobb B, Fan L, Oster R, Sorscher E, Clancy JP. Activation of airway Cl− secretion in human subjects by adenosine. Am J Respir Cell Mol Biol 2004;31:140–146. - PubMed
Publication types
MeSH terms
Substances
Grants and funding
LinkOut - more resources
Full Text Sources
Other Literature Sources
Medical