Cocaine experience controls bidirectional synaptic plasticity in the nucleus accumbens
- PMID: 17652583
- PMCID: PMC6672735
- DOI: 10.1523/JNEUROSCI.1859-07.2007
Cocaine experience controls bidirectional synaptic plasticity in the nucleus accumbens
Abstract
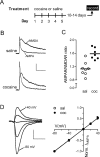
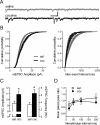
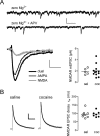
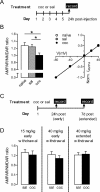
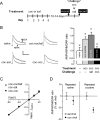
Plasticity of glutamatergic synapses is a fundamental mechanism through which experience changes neural function to impact future behavior. In animal models of addiction, glutamatergic signaling in the nucleus accumbens (NAc) exerts powerful control over drug-seeking behavior. However, little is known about whether, how or when experience with drugs may trigger synaptic plasticity in this key nucleus. Using whole-cell synaptic physiology in NAc brain slices, we demonstrate that a progression of bidirectional changes in glutamatergic synaptic strength occurs after repeated in vivo exposure to cocaine. During a protracted drug-free period, NAc neurons from cocaine-experienced mice develop a robust potentiation of AMPAR-mediated synaptic transmission. However, a single re-exposure to cocaine during extended withdrawal becomes a potent stimulus for synaptic depression, abruptly reversing the initial potentiation. These enduring modifications in AMPAR-mediated responses and plasticity may provide a neural substrate for disrupted processing of drug-related stimuli in drug-experienced individuals.
Figures
Comment in
-
Cocaine experience guides dynamic changes in AMPA receptors within the nucleus accumbens.J Neurosci. 2008 Mar 19;28(12):2967-9. doi: 10.1523/JNEUROSCI.0161-08.2008. J Neurosci. 2008. PMID: 18354000 Free PMC article. No abstract available.
Similar articles
-
Long-term depression in the nucleus accumbens: a neural correlate of behavioral sensitization to cocaine.Nat Neurosci. 2001 Dec;4(12):1217-23. doi: 10.1038/nn757. Nat Neurosci. 2001. PMID: 11694884
-
Cocaine Experience Enhances Thalamo-Accumbens N-Methyl-D-Aspartate Receptor Function.Biol Psychiatry. 2016 Nov 1;80(9):671-681. doi: 10.1016/j.biopsych.2016.04.002. Epub 2016 Apr 7. Biol Psychiatry. 2016. PMID: 27209241 Free PMC article.
-
Cocaine-evoked synaptic plasticity: persistence in the VTA triggers adaptations in the NAc.Nat Neurosci. 2009 Aug;12(8):1036-41. doi: 10.1038/nn.2367. Epub 2009 Jul 13. Nat Neurosci. 2009. PMID: 19597494
-
AMPA receptor plasticity in the nucleus accumbens after repeated exposure to cocaine.Neurosci Biobehav Rev. 2010 Nov;35(2):185-211. doi: 10.1016/j.neubiorev.2010.01.013. Epub 2010 Jan 28. Neurosci Biobehav Rev. 2010. PMID: 20109488 Free PMC article. Review.
-
Regulation of AMPA receptor trafficking in the nucleus accumbens by dopamine and cocaine.Neurotox Res. 2010 Nov;18(3-4):393-409. doi: 10.1007/s12640-010-9176-0. Epub 2010 Apr 2. Neurotox Res. 2010. PMID: 20361291 Free PMC article. Review.
Cited by
-
Kalirin-7 mediates cocaine-induced AMPA receptor and spine plasticity, enabling incentive sensitization.J Neurosci. 2013 Jul 3;33(27):11012-22. doi: 10.1523/JNEUROSCI.1097-13.2013. J Neurosci. 2013. PMID: 23825406 Free PMC article.
-
Repeated in vivo exposure of cocaine induces long-lasting synaptic plasticity in hypocretin/orexin-producing neurons in the lateral hypothalamus in mice.J Physiol. 2013 Apr 1;591(7):1951-66. doi: 10.1113/jphysiol.2012.246983. Epub 2013 Jan 14. J Physiol. 2013. PMID: 23318871 Free PMC article.
-
AMPA Receptor Plasticity in Accumbens Core Contributes to Incubation of Methamphetamine Craving.Biol Psychiatry. 2016 Nov 1;80(9):661-670. doi: 10.1016/j.biopsych.2016.04.003. Epub 2016 Apr 12. Biol Psychiatry. 2016. PMID: 27264310 Free PMC article.
-
Projection-Specific Potentiation of Ventral Pallidal Glutamatergic Outputs after Abstinence from Cocaine.J Neurosci. 2020 Feb 5;40(6):1276-1285. doi: 10.1523/JNEUROSCI.0929-19.2019. Epub 2019 Dec 13. J Neurosci. 2020. PMID: 31836662 Free PMC article.
-
Ovarian Hormones Regulate Nicotine Consumption and Accumbens Glutamatergic Plasticity in Female Rats.eNeuro. 2022 Jun 27;9(3):ENEURO.0286-21.2022. doi: 10.1523/ENEURO.0286-21.2022. Print 2022 May-Jun. eNeuro. 2022. PMID: 35697512 Free PMC article.
References
-
- Abraham WC, Bear MF. Metaplasticity: the plasticity of synaptic plasticity. Trends Neurosci. 1996;19:126–130. - PubMed
-
- Baker DA, McFarland K, Lake RW, Shen H, Tang XC, Toda S, Kalivas PW. Neuroadaptations in cystine-glutamate exchange underlie cocaine relapse. Nat Neurosci. 2003;6:743–749. - PubMed
-
- Beattie EC, Carroll RC, Yu X, Morishita W, Yasuda H, von Zastrow M, Malenka RC. Regulation of AMPA receptor endocytosis by a signaling mechanism shared with LTD. Nat Neurosci. 2000;3:1291–1300. - PubMed
-
- Bellone C, Luscher C. Cocaine triggered AMPA receptor redistribution is reversed in vivo by mGluR-dependent long-term depression. Nat Neurosci. 2006;9:636–641. - PubMed
Publication types
MeSH terms
Substances
Grants and funding
LinkOut - more resources
Full Text Sources
Other Literature Sources
Medical
