Comparative Study
. 2007 Jul 25;27(30):8112-21.
doi: 10.1523/JNEUROSCI.1420-07.2007.

A cholinergic gating mechanism controlled by competitive interactions in the optic tectum of the pigeon

Affiliations
Comparative Study

A cholinergic gating mechanism controlled by competitive interactions in the optic tectum of the pigeon

Gonzalo Marín et al. J Neurosci. .

Abstract

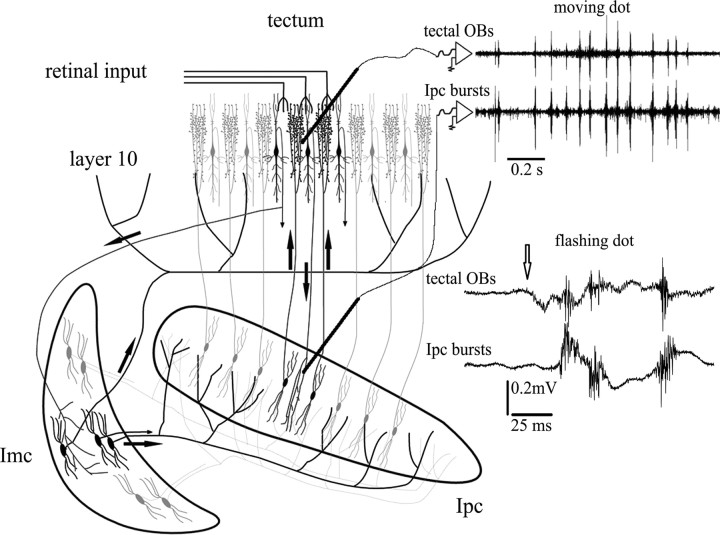
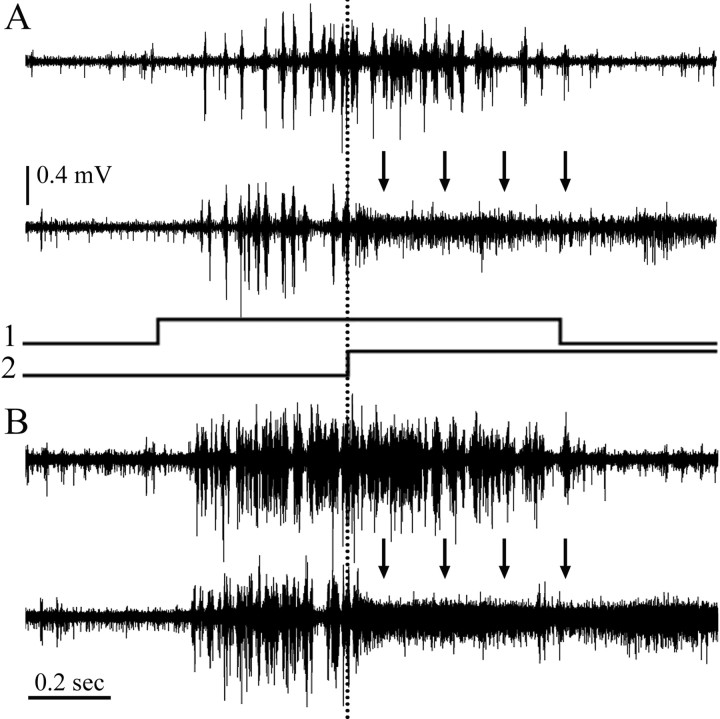
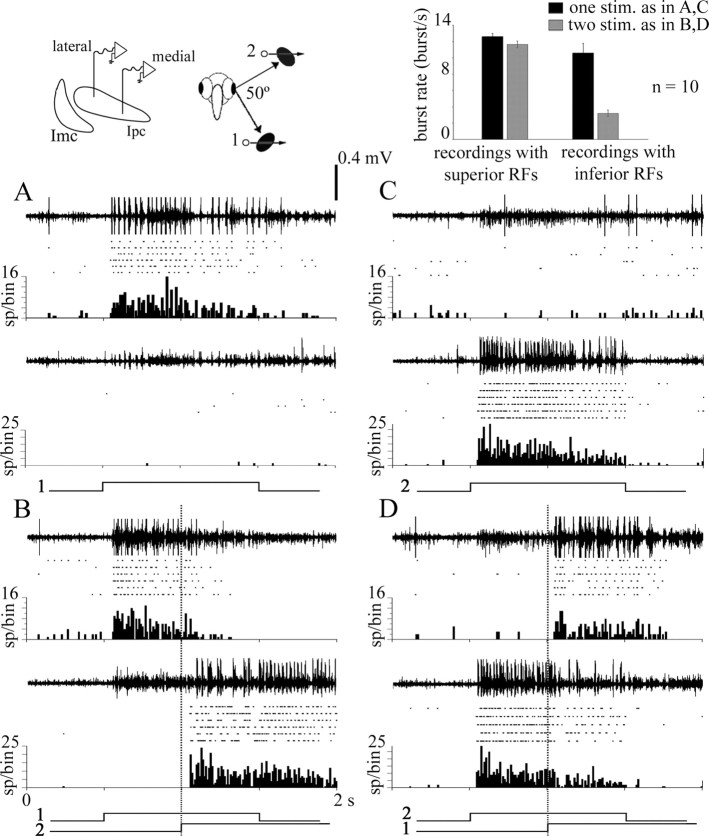
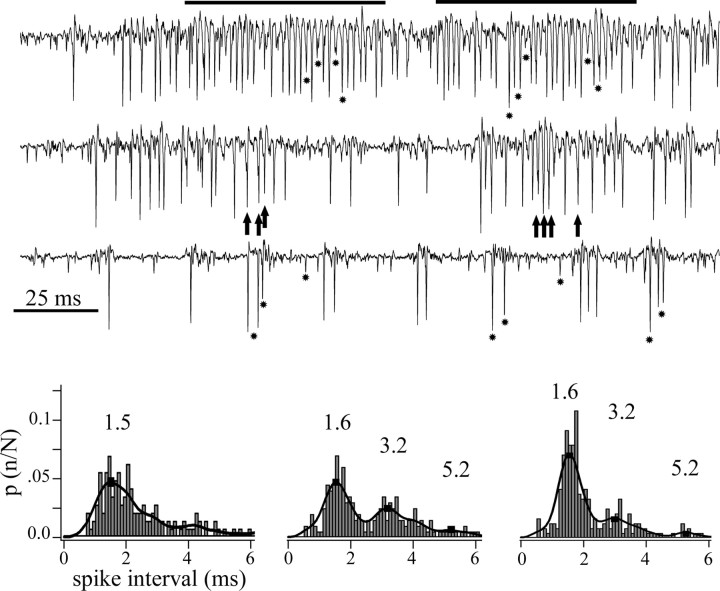
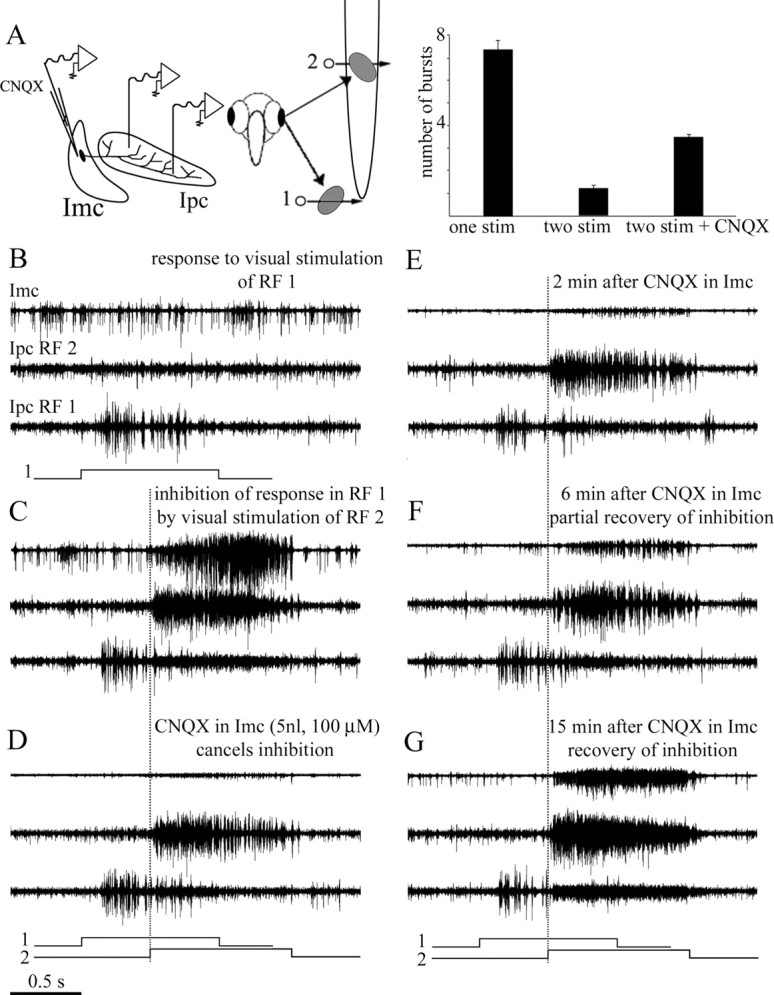
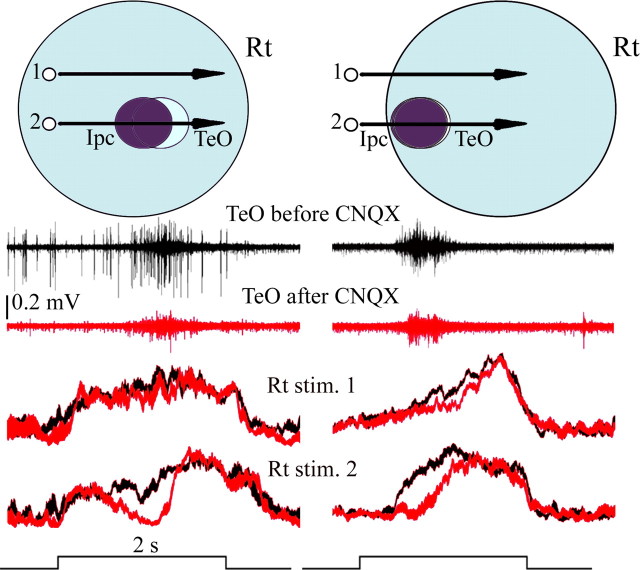
We describe the operation of a midbrain neural circuit in pigeons that may participate in selecting and attending to one visual stimulus from the myriad displayed in their visual environment. This mechanism is based on a topographically organized cholinergic signal reentering the optic tectum (TeO). We have shown previously that, whenever a visual stimulus activates neurons in a given tectal location, this location receives a strong bursting feedback from cholinergic neurons of the nucleus isthmi pars parvocellularis (Ipc), situated underneath the tectum. Here we show that, if a second visual stimulus is presented, even far from the first, the feedback signal to the first tectal location is diminished or suppressed, and feedback to the second tectal location is initiated. We found that this long-range suppressive interaction is mostly mediated by the nucleus isthmi pars magnocellularis, which sends a wide-field GABAergic projection to Ipc and TeO. In addition, two sets of findings indicate that the feedback from the Ipc modulates the ascending output from the TeO. First, visually evoked extracellular responses recorded in the dorsal anterior subdivision of the thalamic nucleus rotundus (RtDa), receiving the ascending tectal output, are closely synchronized to this feedback signal. Second, local inactivation of the Ipc prevents visual responses in RtDa to visual targets moving in the corresponding region of visual space. These results suggest that the ascending transmission of visual activity through the tectofugal pathway is gated by this cholinergic re-entrant signal, whose location within the tectal visual map is dynamically defined by competitive interactions.


Figures

Figure 1.
Figure 1.
Tectal OBs represent re-entrant signals coming from Ipc. Schematic illustrating the synaptic connectivity between the isthmi and TeO. Neurons in the Ipc receive a topographically organized visual input from shepherd-crook neurons of tectal layer 10 and project back to the homotopic location via cholinergic paintbrush axon terminals. Imc neurons receive a coarser projection from shepherd-crook neurons and send widely ramifying, GABAergic terminal fields on most of the Ipc and TeO. Recording traces show mirror-like pattern of bursting responses recorded at homotopic locations in the Ipc and TeO. Moving (40°/s) or flashing (20 ms) a stimulus (2° bright spot) in the shared receptive field of both recording locations triggers bursts of spikes in Ipc neurons that are conducted to the paintbrush axonal terminals in the tectum. This activity is recorded throughout a tectal column as prominent tectal OBs (adapted from Marín et al., 2005).
Figure 2.
Figure 2.
Long-distance suppression of bursting activity in Ipc. A, Top trace, Extracellular recording of bursting activity in Ipc evoked by moving a 2° spot at 45°/s for 1 s (signal trace 1), inside the receptive field. Bottom trace, Same recording location as above but with a second spot of the same size and velocity but 100° higher in the visual field, which began to move when the first stimulus was halfway through its course (signal trace 2). This suppressed the bursting responses from the first spot. Suppressed bursting activity is replaced by high-frequency firing of lower amplitude (arrows). B, Superposition of five traces (stimuli as in A) illustrates the robustness of the phenomenon.
Figure 3.
Figure 3.
Suppressive interactions in Ipc are asymmetric. Dual extracellular recordings of bursting activity in Ipc with tungsten electrodes separated by 0.75 mm in the mediolateral axis. As shown in the schematic, the respective RFs were separated by 50° in the inferior–superior axis. In each panel, the top trace corresponds to the medial recording site (inferior RF), and the bottom trace corresponds to the lateral recording site (superior RF). Below each trace, rasters and cumulative peristimulus time histograms are displayed for six repetitions of each stimulus. Bursting activity elicited from the corresponding RFs was separated from background activity using an amplitude-based window discriminator. The stimulus consisted of either a 2° bright spot moved at 10°/s, for 1 s, within each RF, or of two such spots, the second starting to move when the first was in the middle of its trajectory, as shown by the signal traces underneath each panel. A, Moving a spot in the inferior RF (1) elicited strong bursting responses in the medial recording site. B, Moving a second spot in the superior RF (2) suppressed the responses to the first spot in the medial recording site (p < 0.001, paired t test) and elicited strong bursting responses in the lateral recording site. C, Moving a spot in the superior RFs (2) elicited strong bursting responses in the lateral recording site. D, Moving a second spot in the inferior RF (1) produced a much weaker but significant suppression of the response to the first spot in the lateral recording site (p < 0,001, paired t test). Inset, Summary of results for 10 repetitions of this experiment, in six animals, for RFs separated by 45–100°. Central and superior RFs exerted a strong suppression on bursting responses of inferior RFs, whereas the reverse stimulation produced weak inhibition (both differences were highly significant, p < 0.005, paired t test).
Figure 4.
Figure 4.
High-frequency extracellular activity in Ipc is produced by the synchronized firing of Imc terminals. A, Intracellular recording from a neuron in Imc in response to a 2° bright spot moved at 45°/s in horizontal sweeps in the temporal to nasal direction. Each sweep is 8° lower than the trace above it. In the stereotaxic orientation of the pigeon, the RF of this unit is an elongated diagonal strip of 20° × 80° length, which exceeds the borders of the visual stimulating screen (44°). B, Example of an Imc axon responding with similar characteristics to the same stimulation used in A. C, Simultaneous intracellular recording from a neuron in Imc (bottom black trace; calibration bar, 20 mV) and extracellular recordings from two sites, 0.75 mm apart, in Ipc (top black and gray traces). Note that the high-frequency activity from the two recording sites in Ipc is completely synchronized with each other and with the Imc neuronal spikes. D, Simultaneous recording from an Imc axon (same axon as in B, bottom black trace) and from two sites in Ipc (1 mm tip separation, top black and gray traces) illustrating the same synchronization. E, F, Spike-triggered averages (black lines) of the high-frequency activity traces using the cell and the axon spikes as trigger events. Light gray lines correspond to STAs for shuffled traces.
Figure 5.
Figure 5.
Imc neurons fired spikes at regular intervals during high-frequency episodes. Extracellular recordings of spikes from one site in Imc, evoked by the movement of a 2° bright dot along the major axis of the collective RF. The traces show examples at high, medium, and low spike rates. At low discharge rates (bottom trace), large-, medium-, and small-sized spikes are clearly discernable (asterisks). At intermediate discharge rates (middle trace), individual spikes began to fuse with each other, as noted by small peaks (arrows) within larger, fused spikes. At higher rates (top trace), more spikes merged into long-lasting episodes of a regular high-frequency discharge (indicated by the horizontal bars), in which individual and fused spikes tended to appear at regular time intervals. Bottom, Collective interspike interval histograms for each level of average discharge rate shown above. Note that, at intermediate (center) and high (right) discharge rates, secondary peak intervals appear that are near multiples of the most frequent one (1.6 ms, corresponding to 600 Hz). To compute the interspike interval, spikes were sorted from the background using a window discriminator with an algorithm that rejected peaks separated by <0.5 ms.
Figure 6.
Figure 6.
Long-distance suppression in Ipc is strongly reduced by Imc inactivation. Two tungsten electrodes were positioned in Ipc in the mediolateral axis, recording multiunit bursting responses from two sites in Ipc. The corresponding RFs were separated by 65° in the inferior–superior axis. A third electrode, for recording and injection, recorded multiunit responses from one site in Imc. A, As shown in the schematic, the collective RF from the Imc site had an elongated RF superimposed to the superior RF (2) of the Ipc. In each panel, the top trace corresponds to the Imc recording, and the middle and bottom traces correspond to the Ipc lateral (RF 2) and medial (RF 1) recording sites, respectively. Each trace represents the superimposed recordings of five stimulus repetitions. The stimulus consisted of one or two 2° bright spot moved at 10°/s within each RF, as shown in the schematic underneath each panel. The dotted vertical line marks the beginning of the movement of the second dot. B, Response to visual stimulus of RF 1 only. C, Movement of a dot in the superior RF (RF 2) strongly suppress the response to the first dot moved in the inferior RF (RF 1). D, Inactivation of Imc by CNQX almost completely cancelled the inhibition shown in C. E–G, The inhibition is reestablished, together with the visually evoked activity in Imc, after ∼15 min of recovery. Note that the high-frequency activity in Ipc first diminished with the CNQX application in Imc and then increased during the recovery period. Inset, Summary of results for six repetitions of this experiment in five animals. The cancellation of the induced inhibition provoked by the second stimulus was significantly diminished by the local inactivation of Imc (paired t test, p < 0.005).
Figure 7.
Figure 7.
Visually evoked activity in RtDa is synchronized with tectal OBs. Recording traces show visually evoked synchronized activity (filtered between 300 and 10 kHz) between the tectal OBs (red trace) and the extracellular activity recorded in the RtDa [filtered between 10 Hz and 10 kHz (top black trace) and between 300 Hz and 10 kHz (bottom black trace)]. Most spikes in Rt ride on a positive slow wave especially prominent when using a laser pointer as a visual stimulus (as in the case illustrated). The inset shows the spike-triggered average of Rt activity (10 Hz to 10 kHz) using tectal bursting spikes as trigger events. The schematic illustrates the isthmi-tectal circuit, including one tectal ganglion cell projecting to RtDa. It suggests that the synchronized activity between tectal OBs and RtDa could be produced by fast paintbrush-mediated cholinergic modulation of the retinal input impinging on the dendritic specializations (bottlebrushes) of TGC tectal neurons.
Figure 8.
Figure 8.
Local blockade of the cholinergic feedback to the tectum eliminates visual responses in RtDa from the corresponding location of visual space. Left and right panels illustrate two similar experiments performed in different pigeons. One recording tungsten microelectrode and one dual microelectrode for recording and microinjection were inserted in homotopic locations in TeO and Ipc, respectively, whereas a third microelectrode was inserted in RtDa. Top schematics represent the relative position of the corresponding receptive fields in each case. The stimulus consisted of a bright spot (2°, 44°/s), moved either across the center of the superimposed Ipc and tectal OBs RFs (2) or 20° above (1). Middle traces show tectal OBs in response to stimulus 2 before (dark trace) and after (red trace) injecting CNQX (6–20 nl) in Ipc. CNQX injection eliminates OBs at the tectal recording site. Bottom traces represent visually evoked responses in RtDa, before (dark traces) and after (red traces) CNQX injections in Ipc, to stimuli 1 and 2. Each trace represents 12 individual multiunit recordings, filtered between 300 Hz and 10 kHz, rectified, and smoothed before averaging; trace thickness corresponds to the SE error. Note that Rt activity drops to the baseline after CNQX injection in Ipc when the spot crosses the part of the visual field corresponding to the blocked region (stimulus 2). No effect (left) or a minor effect (right) is observed when the spot is moved above the inactivated field (stimulus 1).

Similar articles

Cited by

References

    1. Appell PP, Behan M. Sources of subcortical GABAergic projections to the superior colliculus in the cat. J Comp Neurol. 1990;302:143–158. - PubMed
    1. Basso MA, Wurtz RH. Modulation of neuronal activity in superior colliculus by changes in target probability. J Neurosci. 1998;18:7519–7534. - PMC - PubMed
    1. Binns KE, Salt TE. The functional influence of nicotinic cholinergic receptors on the visual responses of neurones in the superficial superior colliculus. Vis Neurosci. 2000;17:283–289. - PubMed
    1. Carello CD, Krauzlis RJ. Manipulating intent: evidence for a causal role of the superior colliculus in target selection. Neuron. 2004;43:575–583. - PubMed
    1. Cavanaugh J, Wurtz RH. Subcortical modulation of attention counters change blindness. J Neurosci. 2004;24:11236–11243. - PMC - PubMed

Publication types

LinkOut - more resources