. 2007 Aug;48(8):3645-54.
doi: 10.1167/iovs.06-0876.

Optical coherence tomography and histologic measurements of nerve fiber layer thickness in normal and glaucomatous monkey eyes

Affiliations

Optical coherence tomography and histologic measurements of nerve fiber layer thickness in normal and glaucomatous monkey eyes

Joel S Schuman et al. Invest Ophthalmol Vis Sci. 2007 Aug.

Abstract

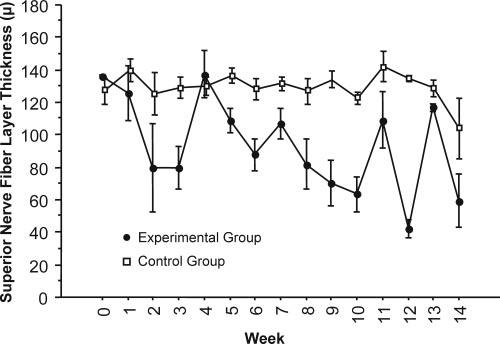
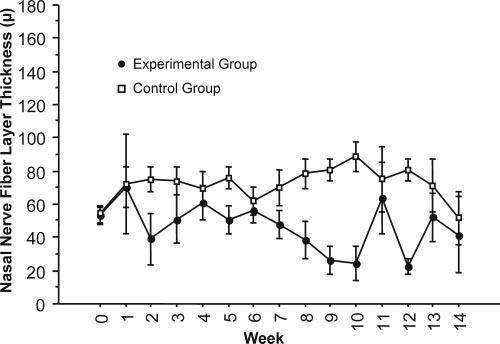
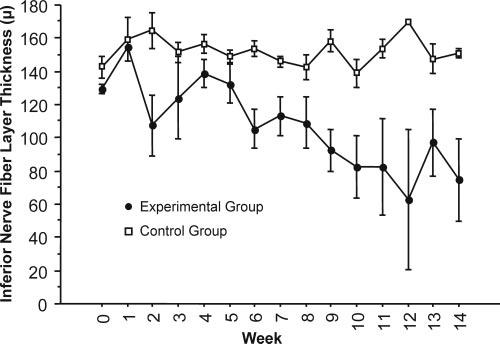
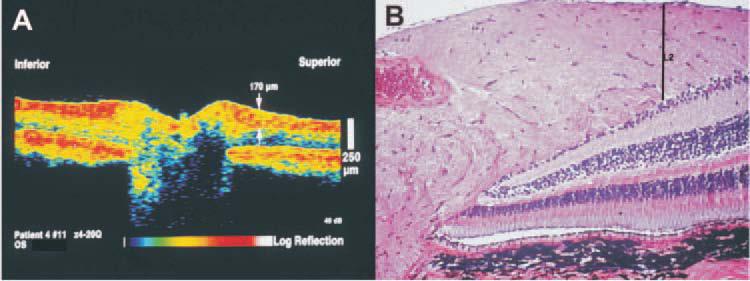
Purpose: To investigate optical coherence tomography (OCT) measurements of retinal nerve fiber layer (RNFL) thickness change associated with elevated intraocular pressure (IOP) over a period of time, and to compare in vivo OCT RNFL thickness measurements with morphologic measurements of the same tissues.

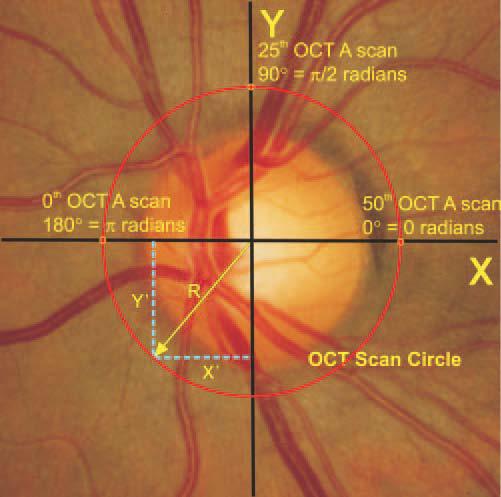
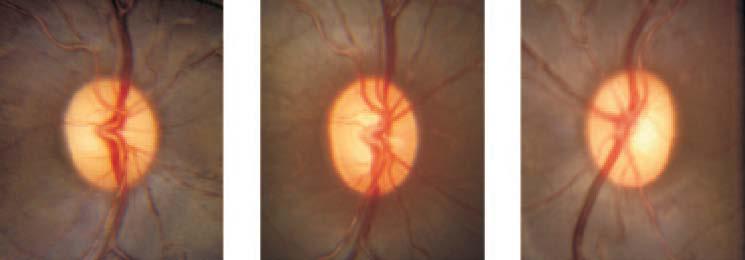
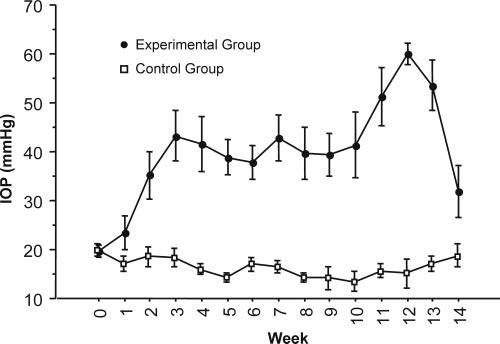
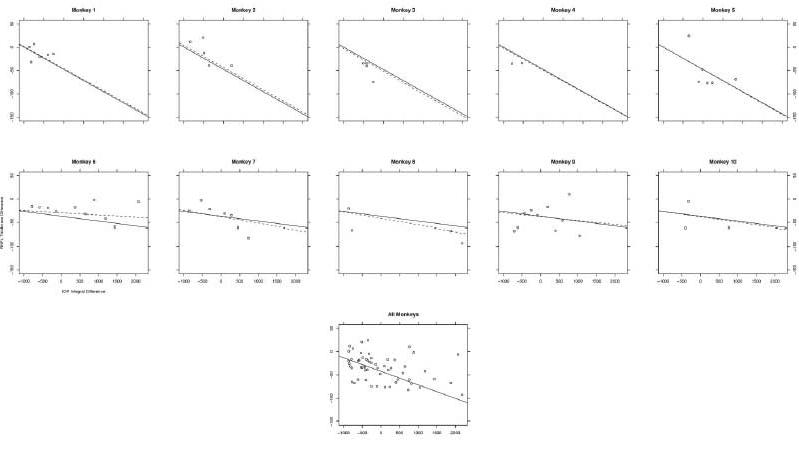
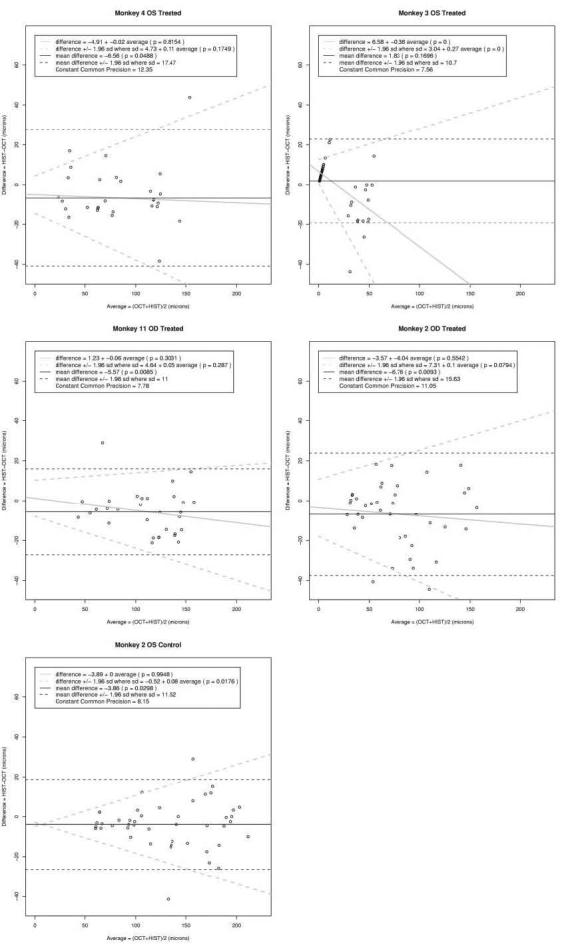
Methods: One eye of each of 12 cynomolgus monkeys was treated with argon laser to the anterior chamber angle to induce elevated IOP. OCT measurements were made weekly in the treated and the contralateral eyes of each monkey for 14 weeks after the laser insult. The monkeys were killed at the conclusion of the experiment, and comparisons were made between the terminal OCT RNFL measurements and quantitative histomorphometric assessments in the same eyes. Effects of exposure to elevated IOP on RNFL were characterized by a mixed-effects model. Linear mixed-effects models provided unbiased analysis of balanced and unbalanced repeated-measures data, detection of group effects (fixed effects), and individual subject effects (random effects), thereby making the best use of all available data.

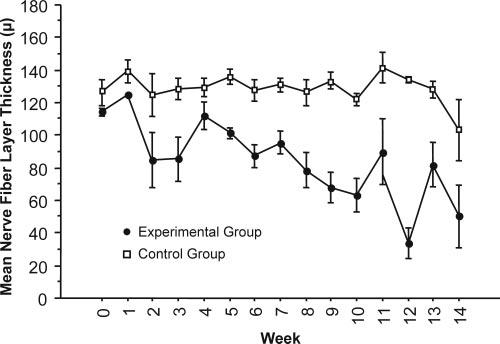
Results: Increased IOP was achieved in 10 eyes. Exposure to high IOP was associated with the loss of mean RNFL thickness at a median rate of 3.77 +/- 0.08 microm/wk. On average, OCT RNFL thickness measurements were higher than histomorphologic measurements by 5.7 microm (95% confidence interval, 3.6-7.8; P = 0.003).

Conclusions: Thinning of the RNFL associated with elevated IOP was demonstrated with OCT in a group of experimentally glaucomatous monkey eyes over a period. OCT measurements corresponded with histomorphometric measurements of the same tissues.


Figures

Figure 1
Figure 1
Schematic diagram of optical coherence tomography scan location and calculation of histologic slice coordinates.
Figure 2
Figure 2
Optic nerve head photographs of experimental eye at baseline (left) and final follow-up (center) and the control eye at final follow-up (right) from a representative monkey. Enlargement of the optic nerve cupping was clearly evident in the experimental eye compared with baseline and control. The baseline optical coherence tomography RNFL thickness measurement in the experimentally glaucomatous eye was 117 μm, and the final RNFL thickness in this eye was 43 μm. Final RNFL thickness in the control eye was 114 μm.
Figure 3
Figure 3
Average intraocular pressure in experimental eyes increased after trabecular meshwork laser ablation but was maintained in control eyes.
Figure 4
Figure 4
Average mean RNFL thickness decreased in experimental eyes and was maintained in control eyes after IOP elevation.
Figure 5
Figure 5
Average superior RNFL thickness decreased in experimental eyes and was maintained in control eyes after IOP elevation.
Figure 6
Figure 6
Average nasal RNFL thickness decreased in experimental eyes and was maintained in control eyes after IOP elevation.
Figure 7
Figure 7
Average inferior RNFL thickness decreased in experimental eyes and was maintained in control eyes after IOP elevation.
Figure 8
Figure 8
Average temporal RNFL thickness decreased in experimental eyes and was maintained in control eyes after IOP elevation.
Figure 9
Figure 9
Exposure to normal IOP is observed as a small positive slope representing the passage of time at normal IOP levels. Exposure to elevated IOP is represented by a large positive slope indicating the same passage of time, but at a higher IOP. Exposure to IOP (+) and mean nerve fiber layer (°) in control eyes (ct) and eyes after laser ablation of the trabecular meshwork (ex). Laser ablation was performed on day 0.
Figure 10
Figure 10
Difference in mean nerve fiber layer thickness between experimental and control eyes, calculated as experimental RNFL – control RNFL, as dependent on the difference in IOP between experimental and control eyes. The solid line is a best-fit line for the entire experimental group, described by the model as the fixed effect. The dashed line is a best-fit line for the individual animal, and it displays the magnitude of influence that each specific monkey (random effect) had on the overall or fixed effects. The “all monkeys” graph displays the association between IOP exposure and RNFL loss for all animals pooled from experiments A and B. As the experimental eye lost RNFL, the difference became increasingly negative, indicating that greater exposure to IOP was associated with a thinner RNFL.
Figure 11
Figure 11
(A) OCT image of a control monkey eye. The arrow indicates the location of the RNFL thickness measurement of 170 μm at a single measuring point out of the 100 points obtained in each OCT circumpapillary scan. (B) Histologic section of the same eye; the line labeled L2 indicates the same tissue location measured in the OCT. Scale bars, 250 μm.
Figure 12
Figure 12
Bland-Altman analysis of the difference between the histomophometric and OCT paired measurements. The black dashed agreement lines assume a constant difference and constant imprecision with level. The solid black line denotes a constant difference. The gray dashed agreement lines allow for a linear trend in the difference and for an increasing imprecision. The gray solid line indicates the change in the difference with level.

References

    1. American Academy of Ophthalmology . Preferred Practice Pattern: Primary Open-Angle Glaucoma. American Academy of Ophthalmology; San Francisco: 2003. pp. 1–40.
    1. Bengtsson B, Heijl A. A long-term prospective study of risk factors for glaucomatous visual field loss in patients with ocular hypertension. J Glaucoma. 2005;14:135–138. - PubMed
    1. Guo L, Moss SE, Alexander RA, Ali RR, Fitzke FW, Cordeiro MF. Retinal ganglion cell apoptosis in glaucoma is related to intraocular pressure and IOP-induced effects on extracellular matrix. Invest Ophthalmol Vis Sci. 2005;46:175–182. - PMC - PubMed
    1. Morrison JC, Johnson EC, Cepurna W, Jia L. Understanding mechanisms of pressure-induced optic nerve damage. Prog Retin Eye Res. 2005;24:217–240. - PubMed
    1. Schuman JS, Hee MR, Arya AV, et al. Optical coherence tomography: a new tool for glaucoma diagnosis. Curr Opin Ophthalmol. 1995;6:89–95. - PubMed

Publication types