

Quantitative morphologic evaluation of magnetic resonance imaging during and after treatment of childhood leukemia
- PMID: 17653705
- PMCID: PMC2386666
- DOI: 10.1007/s00234-007-0262-9
Quantitative morphologic evaluation of magnetic resonance imaging during and after treatment of childhood leukemia
Abstract
Introduction: Medical advances over the last several decades, including CNS prophylaxis, have greatly increased survival in children with leukemia. As survival rates have increased, clinicians and scientists have been afforded the opportunity to further develop treatments to improve the quality of life of survivors by minimizing the long-term adverse effects. When evaluating the effect of antileukemia therapy on the developing brain, magnetic resonance (MR) imaging has been the preferred modality because it quantifies morphologic changes objectively and noninvasively.
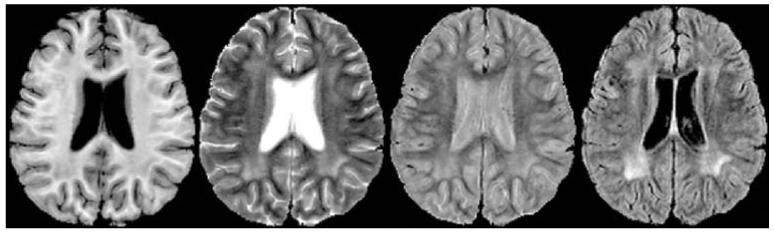
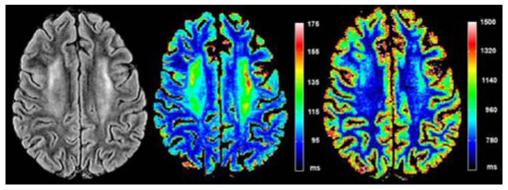
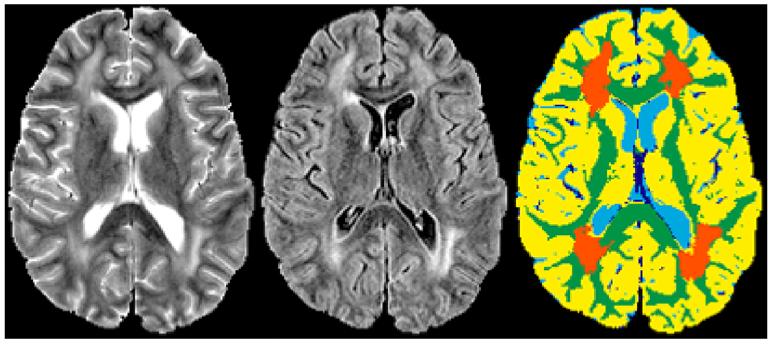
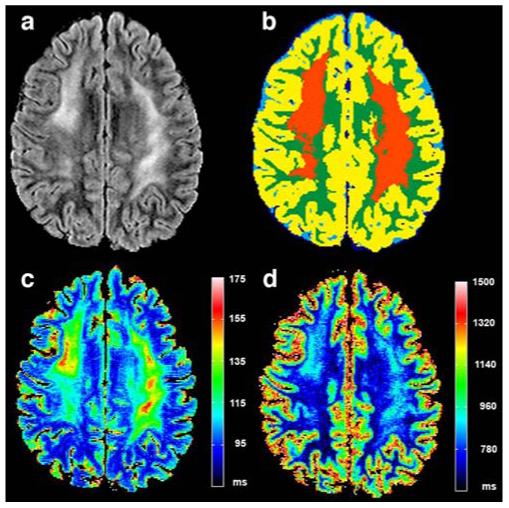
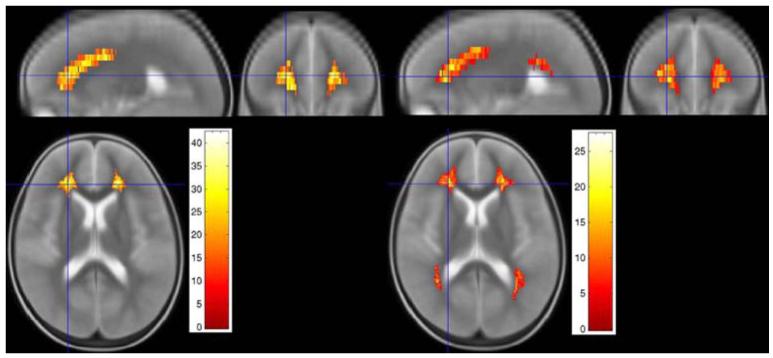
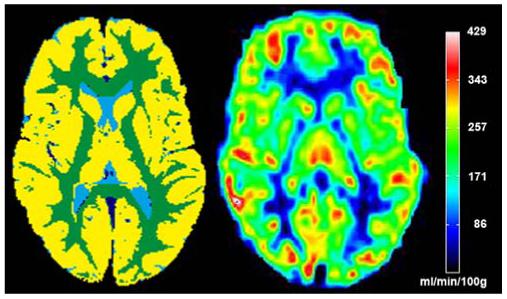
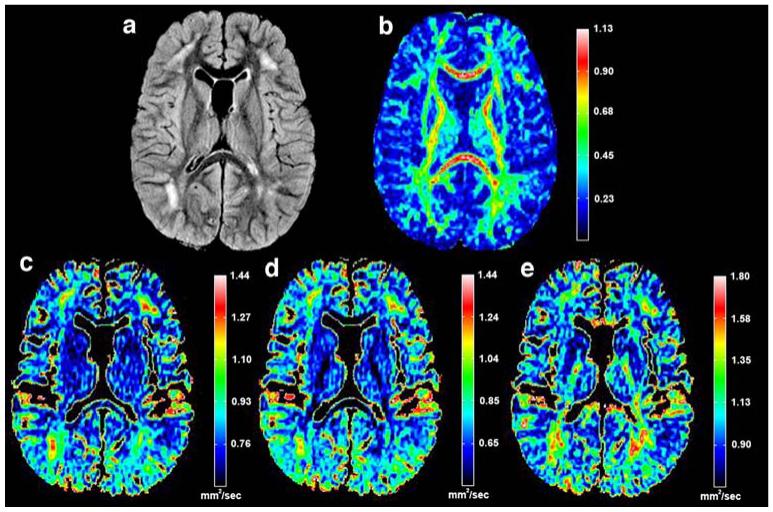
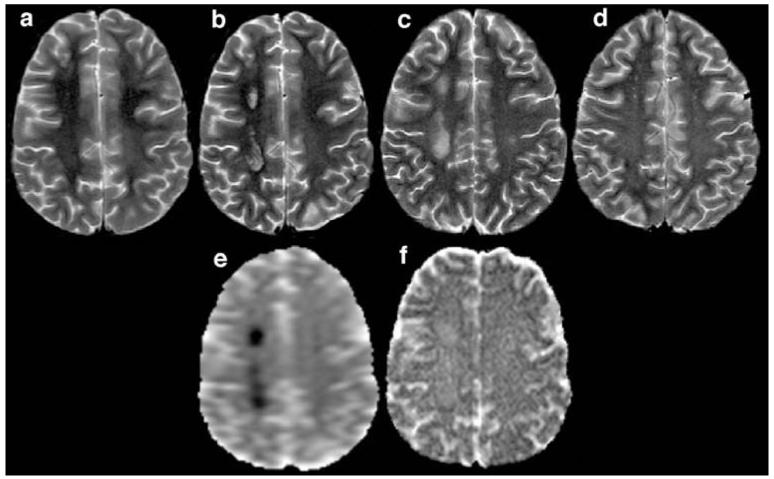
Method and results: Computer-aided detection of changes on neuroimages enables us to objectively differentiate leukoencephalopathy from normal maturation of the developing brain. Quantitative tissue segmentation algorithms and relaxometry measures have been used to determine the prevalence, extent, and intensity of white matter changes that occur during therapy. More recently, diffusion tensor imaging has been used to quantify microstructural changes in the integrity of the white matter fiber tracts. MR perfusion imaging can be used to noninvasively monitor vascular changes during therapy. Changes in quantitative MR measures have been associated, to some degree, with changes in neurocognitive function during and after treatment.
Conclusion: In this review, we present recent advances in quantitative evaluation of MR imaging and discuss how these methods hold the promise to further elucidate the pathophysiologic effects of treatment for childhood leukemia.
Figures
Similar articles
-
The Impact of Persistent Leukoencephalopathy on Brain White Matter Microstructure in Long-Term Survivors of Acute Lymphoblastic Leukemia Treated with Chemotherapy Only.AJNR Am J Neuroradiol. 2018 Oct;39(10):1919-1925. doi: 10.3174/ajnr.A5791. Epub 2018 Sep 13. AJNR Am J Neuroradiol. 2018. PMID: 30213807 Free PMC article.
-
Leukoencephalopathy and long-term neurobehavioural, neurocognitive, and brain imaging outcomes in survivors of childhood acute lymphoblastic leukaemia treated with chemotherapy: a longitudinal analysis.Lancet Haematol. 2016 Oct;3(10):e456-e466. doi: 10.1016/S2352-3026(16)30110-7. Epub 2016 Sep 14. Lancet Haematol. 2016. PMID: 27658980 Free PMC article.
-
White matter fractional anisotropy correlates with speed of processing and motor speed in young childhood cancer survivors.Int J Radiat Oncol Biol Phys. 2009 Jul 1;74(3):837-43. doi: 10.1016/j.ijrobp.2008.08.060. Epub 2008 Dec 29. Int J Radiat Oncol Biol Phys. 2009. PMID: 19117694
-
Diffusion-weighted MR of the brain: methodology and clinical application.Radiol Med. 2005 Mar;109(3):155-97. Radiol Med. 2005. PMID: 15775887 Review. English, Italian.
-
Late effects of childhood leukemia therapy.Curr Hematol Malig Rep. 2011 Sep;6(3):195-205. doi: 10.1007/s11899-011-0094-x. Curr Hematol Malig Rep. 2011. PMID: 21695425 Review.
Cited by
-
Pediatric oncology: methotrexate-exploring dosing and administration in ALCL.Nat Rev Clin Oncol. 2009 Aug;6(8):440-1. doi: 10.1038/nrclinonc.2009.107. Nat Rev Clin Oncol. 2009. PMID: 19644533 No abstract available.
-
Voxel-based analysis of T2 hyperintensities in white matter during treatment of childhood leukemia.AJNR Am J Neuroradiol. 2009 Nov;30(10):1947-54. doi: 10.3174/ajnr.A1733. Epub 2009 Jul 30. AJNR Am J Neuroradiol. 2009. PMID: 19643920 Free PMC article.
-
Investigating verbal and visual auditory learning after conformal radiation therapy for childhood ependymoma.Int J Radiat Oncol Biol Phys. 2010 Jul 15;77(4):1002-8. doi: 10.1016/j.ijrobp.2009.06.003. Epub 2009 Sep 23. Int J Radiat Oncol Biol Phys. 2010. PMID: 19783376 Free PMC article. Clinical Trial.
-
Multi-slice myelin water imaging for practical clinical applications at 3.0 T.Magn Reson Med. 2013 Sep;70(3):813-22. doi: 10.1002/mrm.24527. Epub 2012 Nov 6. Magn Reson Med. 2013. PMID: 23132434 Free PMC article.
-
Development of Communication and Language Skills in Children with Hematological-Oncological Disorders: Challenges and Perspectives.Children (Basel). 2025 Apr 29;12(5):574. doi: 10.3390/children12050574. Children (Basel). 2025. PMID: 40426753 Free PMC article.
References
-
- Pui C-H, Evans WE. Treatment of acute lymphoblastic leukemia. N Engl J Med. 2006;354:166–178. - PubMed
-
- Shuper A, Stark B, Kornreich L, Cohen IJ, Avrahami G, Yaniv I. Methotrexate-related neurotoxicity in the treatment of childhood acute lymphoblastic leukemia. Isr Med Assoc J. 2002;4:1050–1053. - PubMed
-
- Balsom WR, Bleyer WA, Robison LL, Heyn RM, Meadows AT. Intellectual function in long-term survivors of childhood acute lymphoblastic leukemia: protective effects of pre-irradiation methotrexate? A Children’s Cancer Study Group study. Med Pediatr Oncol. 1991;19:486–492. - PubMed
-
- Asato R, Akiyama Y, Ito M, Kubota M, Okumura R, Miki Y, Konishi J, Mikawa H. Nuclear magnetic resonance abnormalities of the cerebral white matter in children with acute lymphoblastic leukemia and malignant lymphoma during and after central nervous system prophylactic treatment with intrathecal methotrexate. Cancer. 1992;70:1997–2004. - PubMed
-
- Refsum H, Wesenberg F, Ueland PM. Plasma homocysteine in children with acute lymphoblastic leukemia: changes during a chemotherapeutic regimen including methotrexate. Cancer Res. 1991;51:828–835. - PubMed
Publication types
MeSH terms
Substances
Grants and funding
LinkOut - more resources
Full Text Sources
Medical
Research Materials
