

SAR and temperature: simulations and comparison to regulatory limits for MRI
- PMID: 17654736
- PMCID: PMC4040525
- DOI: 10.1002/jmri.20977
SAR and temperature: simulations and comparison to regulatory limits for MRI
Abstract
Purpose: To present and discuss numerical calculations of the specific absorption rate (SAR) and temperature in comparison to regulatory limits. While it is possible to monitor whole-body or whole-head average SAR and/or core body temperature during MRI in practice, this is not generally true for local SAR values or local temperatures throughout the body. While methods of calculation for SAR and temperature are constantly being refined, methods for interpreting results of these calculations in light of regulatory limits also warrant discussion.
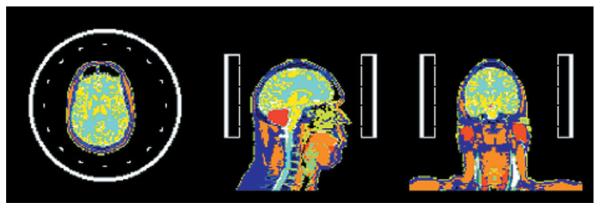
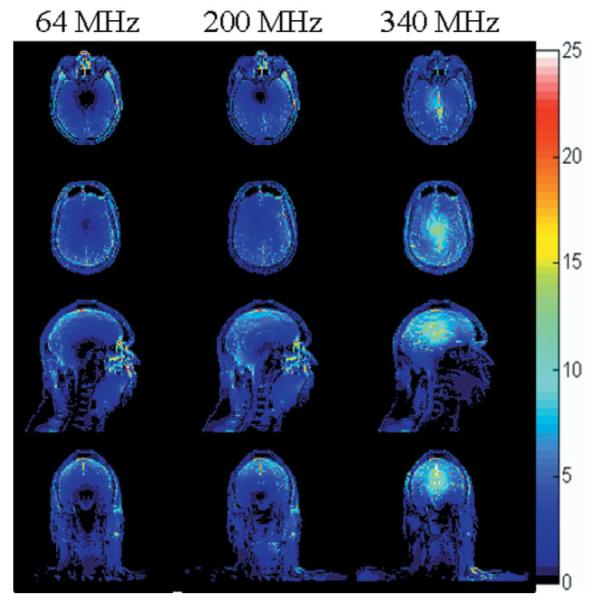
Materials and methods: Numerical calculations of SAR and temperature for the human head in a volume coil for MRI at several different frequencies are presented.
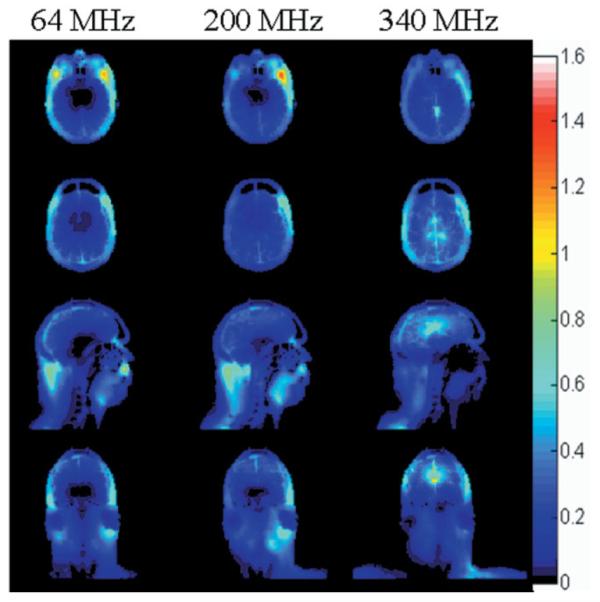
Results: Just as the field pattern changes with the frequency, so do the temperature distribution and the ratio of maximum local SAR (in 1-g or 10-g regions) to whole-head average SAR. In all of the cases studied here this ratio is far greater than that in the regulatory limits, indicating that existing limits on local SAR will be exceeded before limits on whole-body or whole-head average SAR are reached.
Conclusion: Calculations indicate that both SAR and temperature distributions vary greatly with B(1) field frequency, that temperature distributions do not always correlate well with SAR distributions, and that regulatory limits on local temperature may not be exceeded as readily as those on local SAR.
(c) 2007 Wiley-Liss, Inc.
Figures
References
-
- Center for Devices and Radiologic Health . Guidance for the submission of premarket notifications for magnetic resonance diagnostic devices. Food and Drug Administration; Rockville: 1988. http://www.fda.gov/cdrh/ode/guidance/793.html.
-
- International Electrotechnical Commission . International standard, medical equipment—part 2: particular requirements for the safety of magnetic resonance equipment for medical diagnosis. 2nd revision Vol. 601. International Electrotechnical Commission; Geneva: 2002. pp. 2–33.
-
- Collins CM, Smith MB. Signal-to-noise ratio and absorbed power as functions of main magnetic field strength and definition of ‘90’ RF pulse for the head in the birdcage coil. Magn Reson Med. 2001;45:684–691. - PubMed
-
- Collins CM, Li S, Smith MB. SAR and B1 field distributions in a heterogeneous human head model within a birdcage coil. Magn Reson Med. 1998;40:847–856. - PubMed
-
- Collins CM, Smith MB. Spatial resolution of numerical models of man and calculated specific absorption rate using the FDTD method: a study at 64 MHz in a magnetic resonance imaging coil. J Magn Reson Imaging. 2003;18:383–388. - PubMed
Publication types
MeSH terms
Grants and funding
LinkOut - more resources
Full Text Sources
Other Literature Sources
Medical
Miscellaneous
