

Evaluating computer-aided detection algorithms
- PMID: 17654906
- PMCID: PMC2041901
- DOI: 10.1118/1.2736289
Evaluating computer-aided detection algorithms
Erratum in
- Med Phys. 2008 Nov;35(11):5197
-
Erratum: "Evaluating computer-aided detection algorithms".Med Phys. 2008 Nov;35(11):5197. doi: 10.1118/1.2995750. Med Phys. 2008. PMID: 28524966 No abstract available.
Abstract
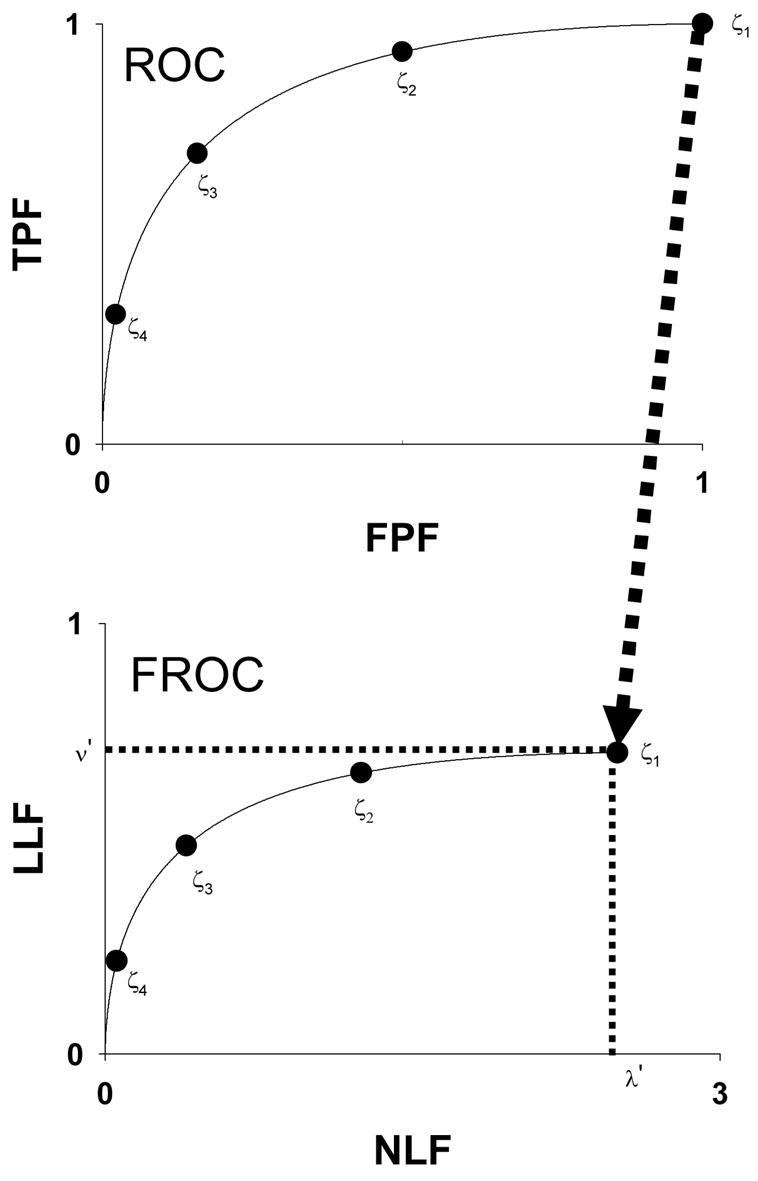
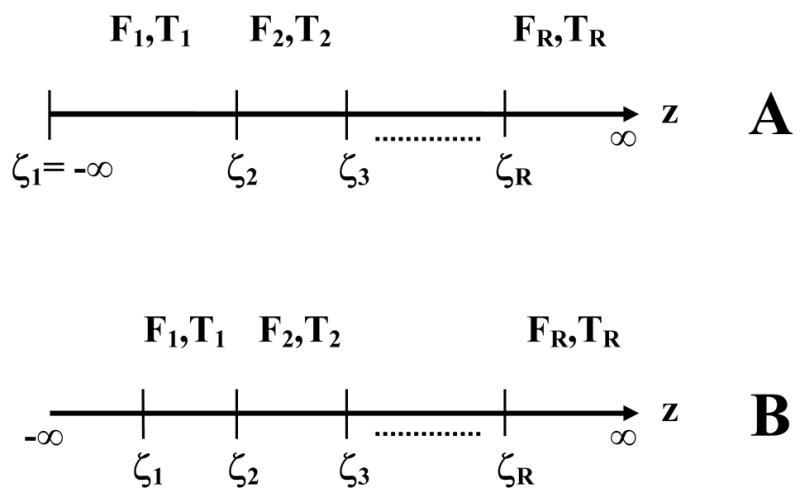
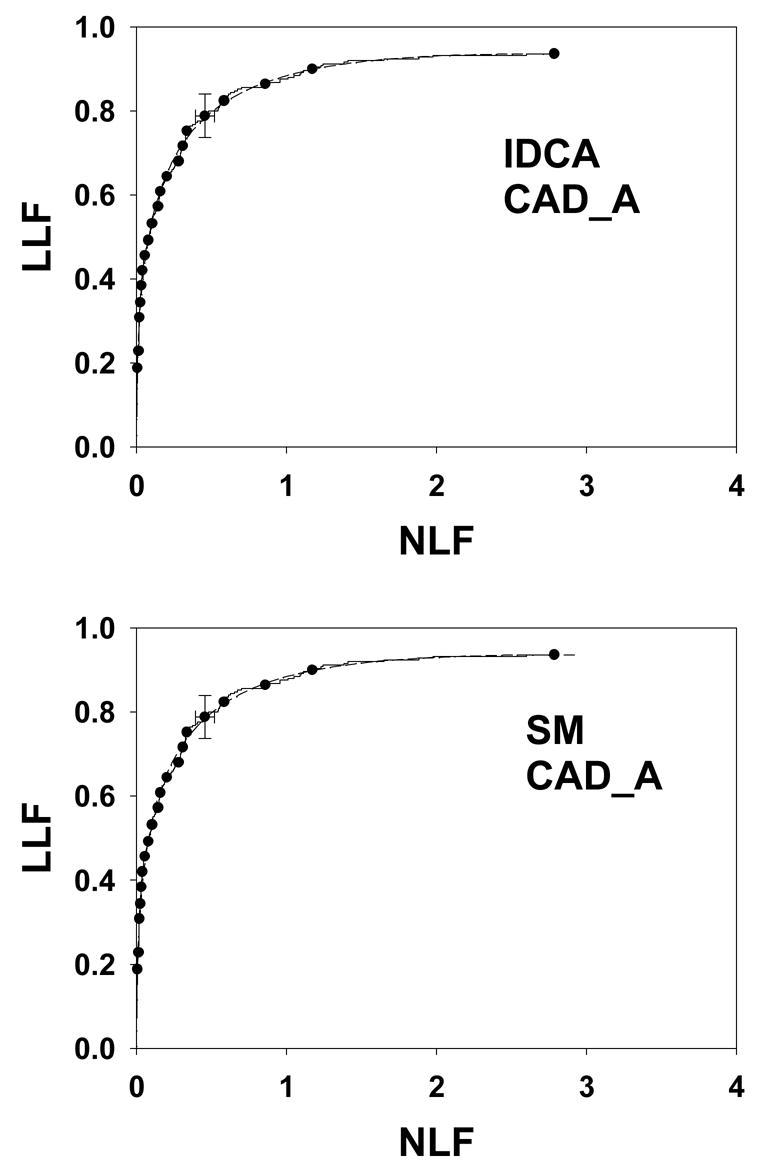
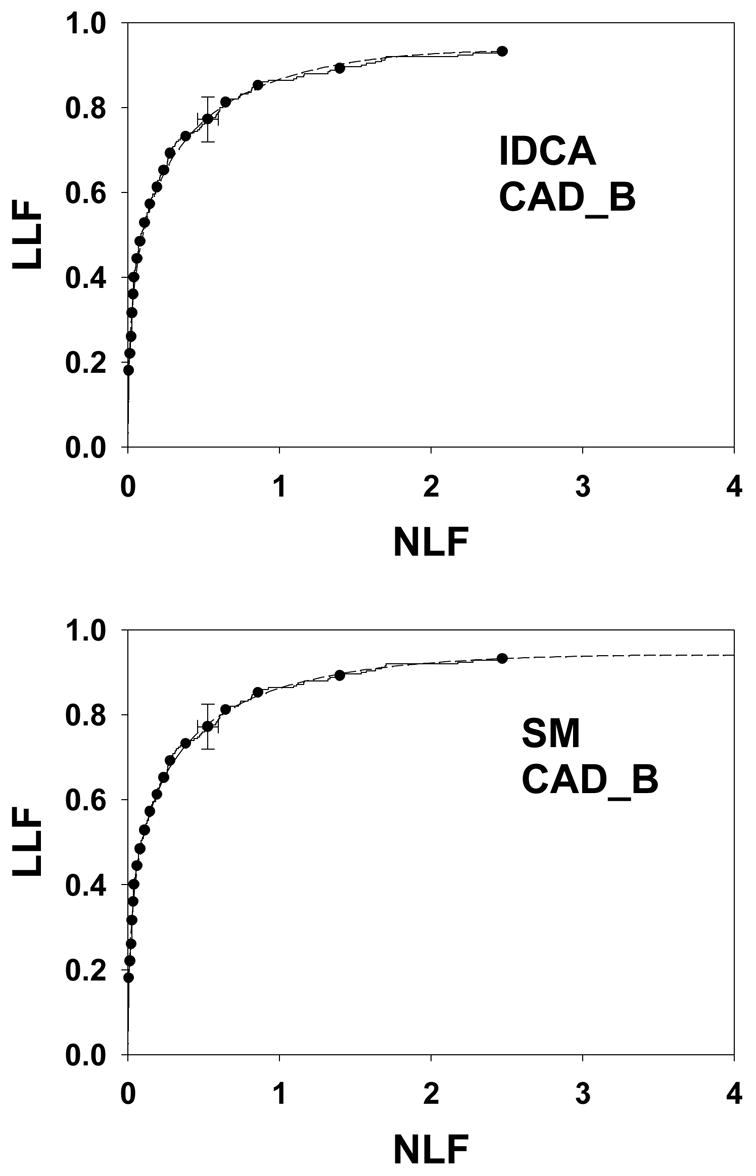
Computer-aided detection (CAD) has been attracting extensive research interest during the last two decades. It is recognized that the full potential of CAD can only be realized by improving the performance and robustness of CAD algorithms and this requires good evaluation methodology that would permit CAD designers to optimize their algorithms. Free-response receiver operating characteristic (FROC) curves are widely used to assess CAD performance, however, evaluation rarely proceeds beyond determination of lesion localization fraction (sensitivity) at an arbitrarily selected value of nonlesion localizations (false marks) per image. This work describes a FROC curve fitting procedure that uses a recent model of visual search that serves as a framework for the free-response task. A maximum likelihood procedure for estimating the parameters of the model from free-response data and fitting CAD generated FROC curves was implemented. Procedures were implemented to estimate two figures of merit and associated statistics such as 95% confidence intervals and goodness of fit. One of the figures of merit does not require the arbitrary specification of an operating point at which to evaluate CAD performance. For comparison a related method termed initial detection and candidate analysis was also implemented that is applicable when all suspicious regions are reported. The two methods were tested on seven mammography CAD data sets and both yielded good to excellent fits. The search model approach has the advantage that it can potentially be applied to radiologist generated free-response data where not all suspicious regions are reported, only the ones that are deemed sufficiently suspicious to warrant clinical follow-up. This work represents the first practical application of the search model to an important evaluation problem in diagnostic radiology. Software based on this work is expected to benefit CAD developers working in diverse areas of medical imaging.
Figures

References
-
- Brake GM, Karssemeijer N, Hendriks JH. Automated detection of breast carcinomas not detected in a screening program. Radiology. 1998;207:465–471. - PubMed
-
- Birdwell RL, Ikeda DM, O’Shaughnessy KF, et al. Mammographic characteristics of 115 missed cancers later detected with screening mammography and the potential utility of computer-aided detection. Radiology. 2001;219:192–202. - PubMed
-
- White CS, Romney BM, Mason AC, et al. Primary carcinoma of the lung overlooked at CT: analysis of findings in 14 patients. Radiology. 1996;199:109–115. - PubMed
-
- Kakinuma R, Ohmatsu H, Kaneko M, et al. Detection failures in spiral CT screening for lung cancer: analysis of CT findings. Radiology. 1999;212:61–66. - PubMed
Publication types
MeSH terms
Grants and funding
LinkOut - more resources
Full Text Sources
Medical
Miscellaneous
