A novel approach for prediction of tacrolimus blood concentration in liver transplantation patients in the intensive care unit through support vector regression
- PMID: 17655766
- PMCID: PMC2206504
- DOI: 10.1186/cc6081
A novel approach for prediction of tacrolimus blood concentration in liver transplantation patients in the intensive care unit through support vector regression
Abstract
Introduction: Tacrolimus is an important immunosuppressive drug for organ transplantation patients. It has a narrow therapeutic range, toxic side effects, and a blood concentration with wide intra- and interindividual variability. Hence, it is of the utmost importance to monitor tacrolimus blood concentration, thereby ensuring clinical effect and avoiding toxic side effects. Prediction models for tacrolimus blood concentration can improve clinical care by optimizing monitoring of these concentrations, especially in the initial phase after transplantation during intensive care unit (ICU) stay. This is the first study in the ICU in which support vector machines, as a new data modeling technique, are investigated and tested in their prediction capabilities of tacrolimus blood concentration. Linear support vector regression (SVR) and nonlinear radial basis function (RBF) SVR are compared with multiple linear regression (MLR).
Methods: Tacrolimus blood concentrations, together with 35 other relevant variables from 50 liver transplantation patients, were extracted from our ICU database. This resulted in a dataset of 457 blood samples, on average between 9 and 10 samples per patient, finally resulting in a database of more than 16,000 data values. Nonlinear RBF SVR, linear SVR, and MLR were performed after selection of clinically relevant input variables and model parameters. Differences between observed and predicted tacrolimus blood concentrations were calculated. Prediction accuracy of the three methods was compared after fivefold cross-validation (Friedman test and Wilcoxon signed rank analysis).
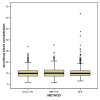
Results: Linear SVR and nonlinear RBF SVR had mean absolute differences between observed and predicted tacrolimus blood concentrations of 2.31 ng/ml (standard deviation [SD] 2.47) and 2.38 ng/ml (SD 2.49), respectively. MLR had a mean absolute difference of 2.73 ng/ml (SD 3.79). The difference between linear SVR and MLR was statistically significant (p < 0.001). RBF SVR had the advantage of requiring only 2 input variables to perform this prediction in comparison to 15 and 16 variables needed by linear SVR and MLR, respectively. This is an indication of the superior prediction capability of nonlinear SVR.
Conclusion: Prediction of tacrolimus blood concentration with linear and nonlinear SVR was excellent, and accuracy was superior in comparison with an MLR model.
Figures


Similar articles
-
[Prediction of blood tacrolimus concentration in liver transplantation recipients by artificial neural network].Yao Xue Xue Bao. 2012 Sep;47(9):1134-40. Yao Xue Xue Bao. 2012. PMID: 23227541 Chinese.
-
Therapeutic monitoring of tacrolimus concentrations in blood of renal and liver transplant recipients: comparison of microparticle enzyme immunoassay and enzyme multiplied immunoassay methods.Transplant Proc. 2006 Jan-Feb;38(1):94-6. doi: 10.1016/j.transproceed.2005.12.042. Transplant Proc. 2006. PMID: 16504673
-
Effects of some hematological parameters on whole blood tacrolimus concentration measured by two immunoassay-based analytical methods.Clin Biochem. 2005 Jun;38(6):552-7. doi: 10.1016/j.clinbiochem.2005.02.011. Clin Biochem. 2005. PMID: 15885236
-
[Clinical pharmacokinetics and therapeutic monitoring of tacrolimus].Therapie. 1997 Jul-Aug;52(4):345-52. Therapie. 1997. PMID: 9437890 Review. French.
-
Opportunities to optimize tacrolimus therapy in solid organ transplantation: report of the European consensus conference.Ther Drug Monit. 2009 Apr;31(2):139-52. doi: 10.1097/FTD.0b013e318198d092. Ther Drug Monit. 2009. PMID: 19177031
Cited by
-
Effects of CYP3A5 Genotypes on Thrombocytopenia in Liver Transplantation Patients Treated with Tacrolimus.Biomedicines. 2023 Nov 17;11(11):3088. doi: 10.3390/biomedicines11113088. Biomedicines. 2023. PMID: 38002088 Free PMC article.
-
Predicting Blood Concentration of Tacrolimus in Patients With Autoimmune Diseases Using Machine Learning Techniques Based on Real-World Evidence.Front Pharmacol. 2021 Sep 24;12:727245. doi: 10.3389/fphar.2021.727245. eCollection 2021. Front Pharmacol. 2021. PMID: 34630104 Free PMC article.
-
Predictive data mining on monitoring data from the intensive care unit.J Clin Monit Comput. 2013 Aug;27(4):449-53. doi: 10.1007/s10877-012-9416-3. Epub 2012 Nov 24. J Clin Monit Comput. 2013. PMID: 23179020
-
Commentary: Predicting blood concentration of tacrolimus in patients with autoimmune diseases using machine learning techniques based on real-world evidence.Front Pharmacol. 2022 Nov 3;13:1000476. doi: 10.3389/fphar.2022.1000476. eCollection 2022. Front Pharmacol. 2022. PMID: 36408265 Free PMC article. No abstract available.
-
A Machine Learning-Based Identification of Genes Affecting the Pharmacokinetics of Tacrolimus Using the DMETTM Plus Platform.Int J Mol Sci. 2020 Apr 4;21(7):2517. doi: 10.3390/ijms21072517. Int J Mol Sci. 2020. PMID: 32260456 Free PMC article.
References
-
- Kershner RP, Fitzsimmons WE. Relationship of FK506 whole blood concentrations and efficacy and toxicity after liver and kidney transplantation. Transplantation. 1996;62:920–926. - PubMed
-
- Decruyenaere J, De Turck F, Vanhastel S, Vandermeulen F, Demeester P, de Moor G. On the design of a generic and scalable multilayer software architecture for data flow management in the intensive care unit. Methods Inf Med. 2003;42:79–88. - PubMed
-
- De Turck F, Decruyenaere J, Thysebaert P, Van Hoecke S, Volckaert B, Danneels C, Colpaert K, De Moor G. Design of a flexible platform for execution of medical decision support agents in the intensive care unit. Comput Biol Med. 2007;37:97–112. - PubMed
Publication types
MeSH terms
Substances
LinkOut - more resources
Full Text Sources
Other Literature Sources
Medical

