Comparative Study
. 2007 Jul 26:7:123.
doi: 10.1186/1471-2148-7-123.

Comparative mitochondrial genomics of snakes: extraordinary substitution rate dynamics and functionality of the duplicate control region

Affiliations
Comparative Study

Comparative mitochondrial genomics of snakes: extraordinary substitution rate dynamics and functionality of the duplicate control region

Zhi J Jiang et al. BMC Evol Biol. .

Abstract

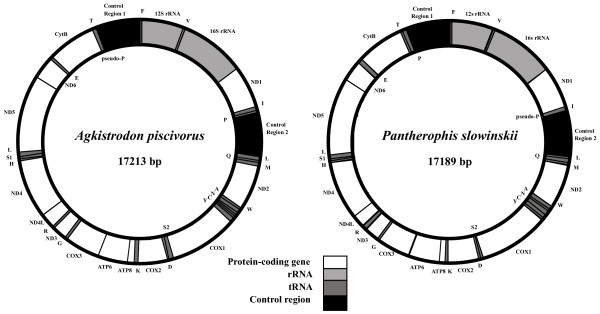
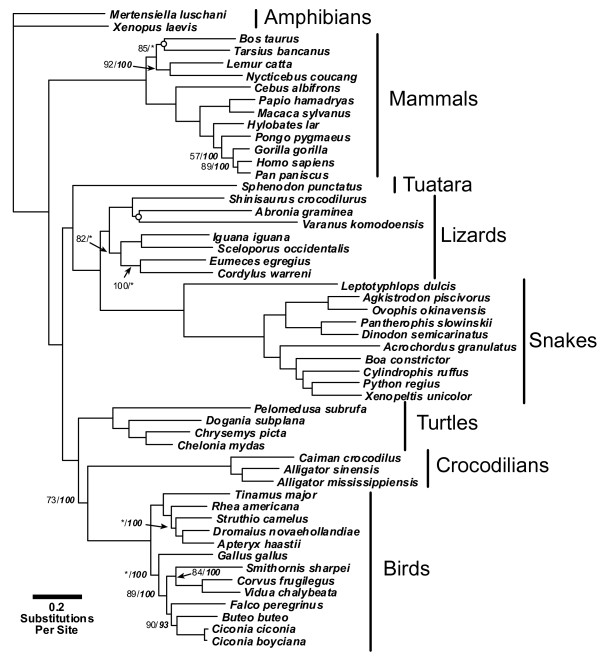
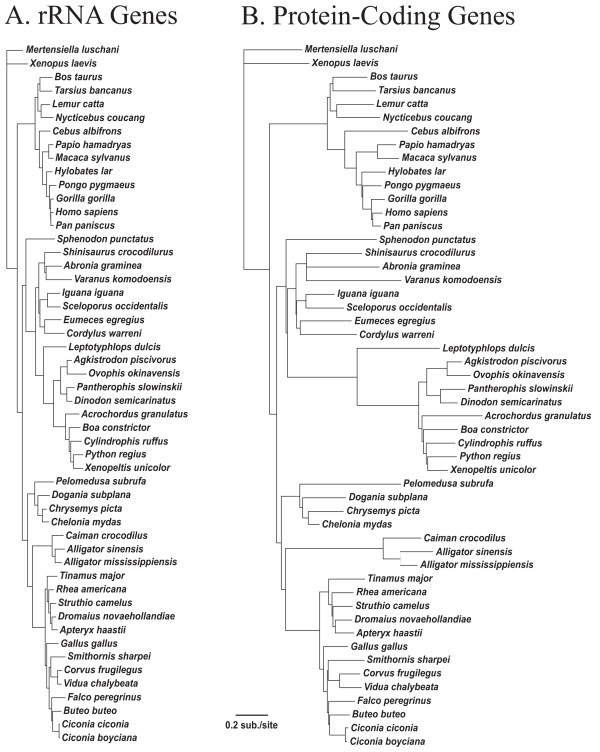
Background: The mitochondrial genomes of snakes are characterized by an overall evolutionary rate that appears to be one of the most accelerated among vertebrates. They also possess other unusual features, including short tRNAs and other genes, and a duplicated control region that has been stably maintained since it originated more than 70 million years ago. Here, we provide a detailed analysis of evolutionary dynamics in snake mitochondrial genomes to better understand the basis of these extreme characteristics, and to explore the relationship between mitochondrial genome molecular evolution, genome architecture, and molecular function. We sequenced complete mitochondrial genomes from Slowinski's corn snake (Pantherophis slowinskii) and two cottonmouths (Agkistrodon piscivorus) to complement previously existing mitochondrial genomes, and to provide an improved comparative view of how genome architecture affects molecular evolution at contrasting levels of divergence.

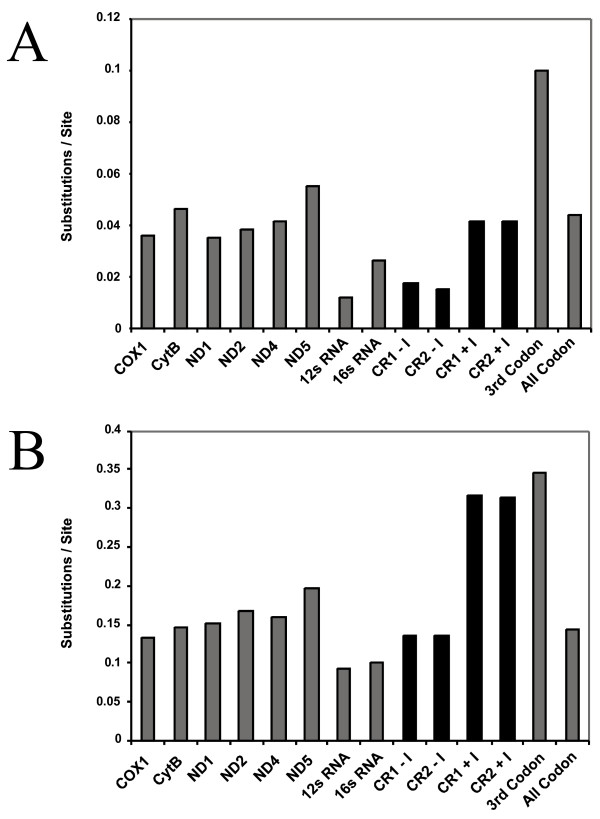
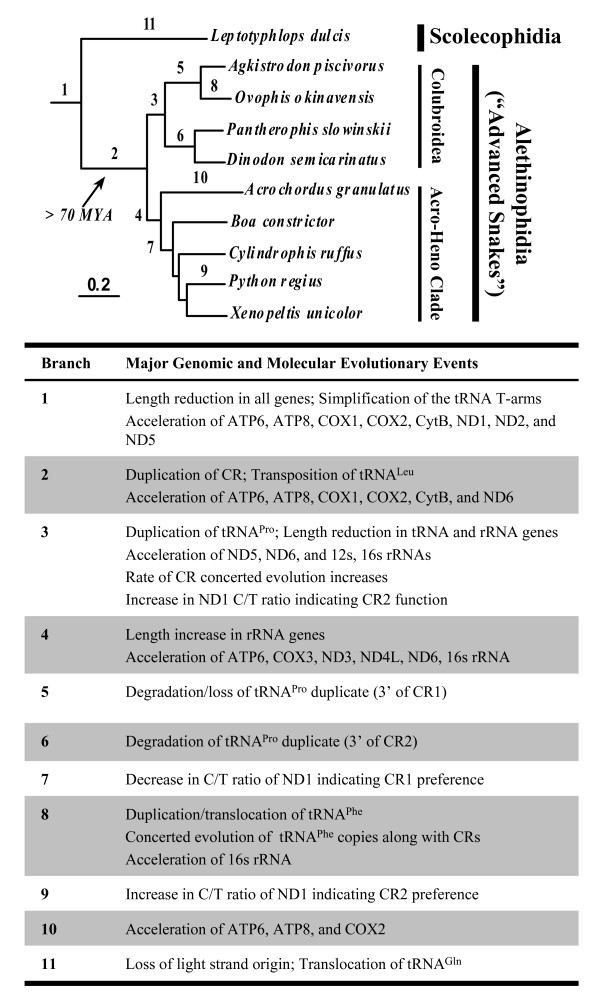
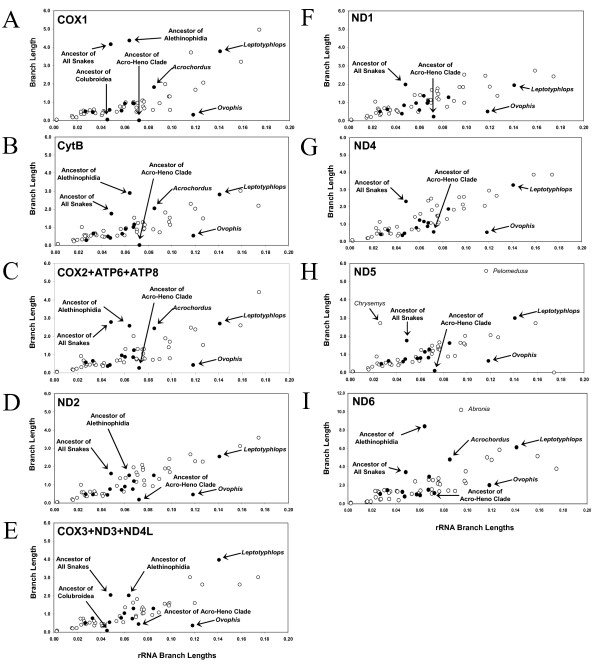
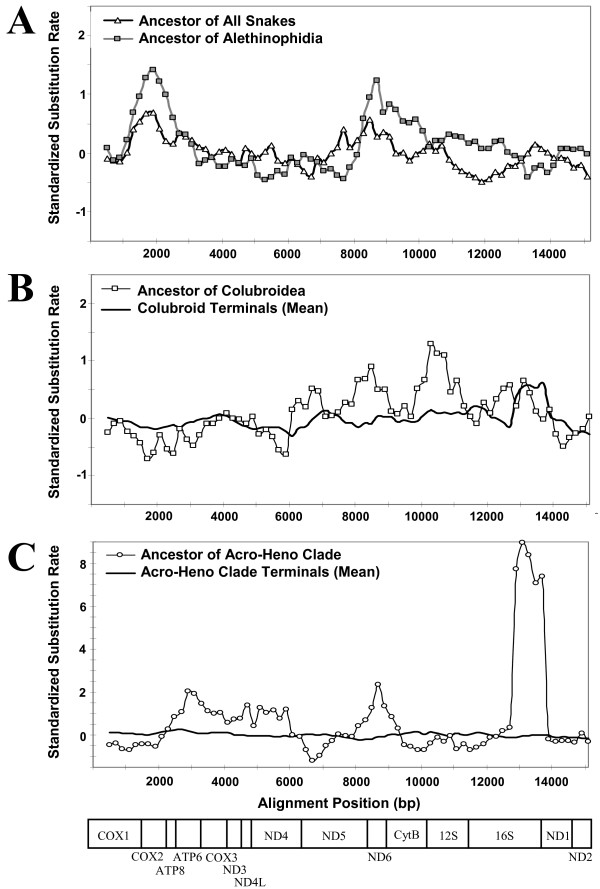
Results: We present a Bayesian genetic approach that suggests that the duplicated control region can function as an additional origin of heavy strand replication. The two control regions also appear to have different intra-specific versus inter-specific evolutionary dynamics that may be associated with complex modes of concerted evolution. We find that different genomic regions have experienced substantial accelerated evolution along early branches in snakes, with different genes having experienced dramatic accelerations along specific branches. Some of these accelerations appear to coincide with, or subsequent to, the shortening of various mitochondrial genes and the duplication of the control region and flanking tRNAs.

Conclusion: Fluctuations in the strength and pattern of selection during snake evolution have had widely varying gene-specific effects on substitution rates, and these rate accelerations may have been functionally related to unusual changes in genomic architecture. The among-lineage and among-gene variation in rate dynamics observed in snakes is the most extreme thus far observed in animal genomes, and provides an important study system for further evaluating the biochemical and physiological basis of evolutionary pressures in vertebrate mitochondria.


Figures

Figure 1
Figure 1
Annotated mitochondrial genome maps of Agkistrodon piscivorus and Pantherophis slowinskii. The two A. piscivorus samples (Api1 and Api2) have identical annotations except for minor variations in gene length. Labels of genes outside the circle refer to genes transcribed from the light strand, and names within the circle represent genes transcribed from the heavy strand.
Figure 2
Figure 2
Differences per site for homologous genes or groups of sites in the two Agkistrodon piscivorus genomes and in the two viperid genomes . The differences per site are shown for a comparison of Api1 and Api2 (A), and for A. piscivorus (mean of Api1 and Api2) and Ovophis okinavensis (B). Differences are shown only for the longer protein-coding genes. For the control regions only (shaded black), differences are shown for each aligned site including indels (e.g., CR1+I), or excluding indels (e.g., CR1-I). For all other genes, indels are not included in the difference measure. The bars for 3rd codon positions (3 rd Codon) and for all codon positions (All Codon) are summed over all protein-coding genes.
Figure 3
Figure 3
Maximum likelihood phylogeny for vertebrate taxa included in this study.This phylogeny is based on all protein-coding and rRNA genes. Most branches have greater than 95% support for both NJ ML distance bootstrap and Bayesian posterior probability support (see Methods), and are not annotated with support values. Where support from either measure is less than 95%, the support values are indicated by ratios, with the ML bootstrap support on top and the Bayesian posterior probability support below in italics, except for two nodes with less than 50% support by either measure, which are indicated by a hollow circle. Other than for these two nodes, support values less than 50% are indicated with an asterisk (*).
Figure 4
Figure 4
Hypotheses for the relative timing of alterations in mitochondrial genome architecture and molecular evolution throughout snake phylogeny. The topological relationships among snakes and branch lengths shown are the same as in Figure 3. Major groups of snakes are indicated along with the approximate diversification time of the Alethinophidia.
Figure 5
Figure 5
Phylograms based on the relative branch lengths for rRNA and protein-coding genes. Branch lengths were estimated on the topology of the ML phylogeny (Figure 3). Branch lengths on this constrained topology were estimated using all rRNA genes (A) or all protein-coding genes (B). The substitution rate scale is the same in both trees.
Figure 6
Figure 6
Plot of branch lengths obtained from rRNA versus various genes and gene clusters. Branches leading to the most recent common ancestor of a group are labeled e.g. "Ancestor of All Snakes". Snake branches are indicated with filled circles, and non-snake tetrapod branches are indicated with an unfilled circle. The locations of selected snake branches are labeled (in bold) with arrows. Outlying non-snake branches are indicated and labeled in normal type. Genes and gene clusters shown are (A) COX1, (B) CytB, (C) COX2 + ATP6 + ATP8, (D) ND2, and (E) COX3 + ND3 + ND4L, (F) ND1, (G) ND4, (H) ND5, (I) ND6.
Figure 7
Figure 7
Standardized substitution rates across the mitochondrial genome for selected branches or clusters. For each 1000 bp window applied to a set of branches, standardized substitution rates were obtained by first dividing by the median window value for that branch, and then subtracting this value from the average across all non-snake branches. This helps to visualize regions of the genome that are evolving at slower or faster rates, with the average tetrapod relative rate being zero. Branches or branch sets shown are (A) the branch leading to the most recent common ancestor of all snakes and of the Alethinophidia; (B) the branch leading to the most recent common ancestor of the Colubroidea and the sum of all colubroid terminal branches; and (C) the branch leading to the most recent common ancestor of the Acro-Heno clade and the sum of all Acro-Heno clade terminal branches.

Similar articles

Cited by

References

    1. Krishnan NM, Raina SZ, Pollock DD. Analysis of among-site variation in substitution patterns. Biol Proced Online. 2004;6:180–188. doi: 10.1251/bpo88. - DOI - PMC - PubMed
    1. Krishnan NM, Seligmann H, Raina SZ, Pollock DD. Detecting gradients of asymmetry in site-specific substitutions in mitochondrial genomes. DNA Cell Biol. 2004;23:707–714. doi: 10.1089/dna.2004.23.707. - DOI - PMC - PubMed
    1. Raina SZ, Faith JJ, Disotell TR, Seligmann H, Stewart CB, Pollock DD. Evolution of base-substitution gradients in primate mitochondrial genomes. Genome Res. 2005;15:665–673. doi: 10.1101/gr.3128605. - DOI - PMC - PubMed
    1. Faith JJ, Pollock DD. Likelihood analysis of asymmetrical mutation bias gradients in vertebrate mitochondrial genomes. Genetics. 2003;165:735–745. - PMC - PubMed
    1. Reyes A, Gissi C, Pesole G, Saccone C. Asymmetrical directional mutation pressure in the mitochondrial genome of mammals. Mol Biol Evol. 1998;15:957–966. - PubMed

Publication types

LinkOut - more resources