

Nicotine's attenuation of body weight involves the perifornical hypothalamus
- PMID: 17655879
- PMCID: PMC2725327
- DOI: 10.1016/j.lfs.2007.06.010
Nicotine's attenuation of body weight involves the perifornical hypothalamus
Abstract
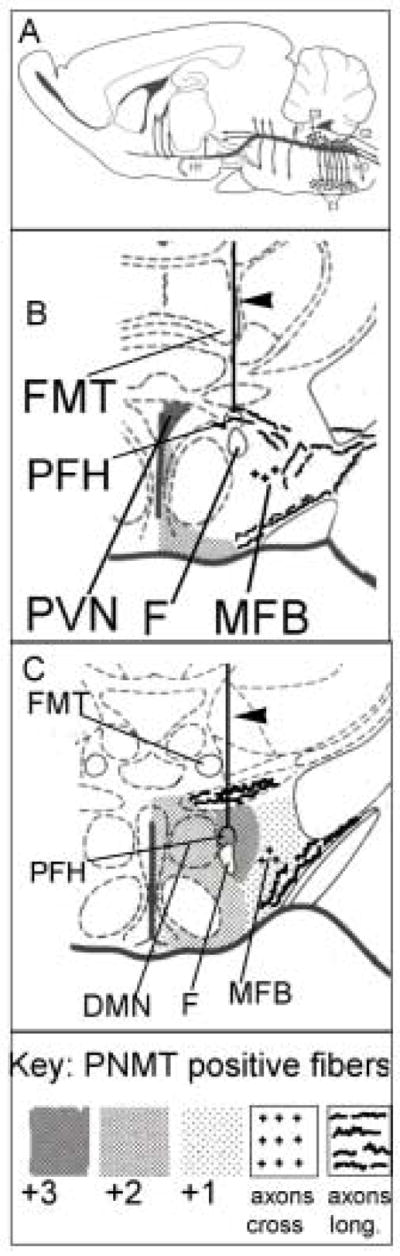
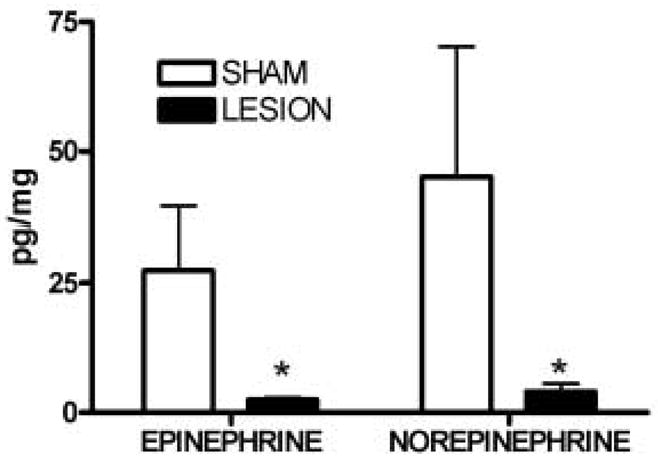
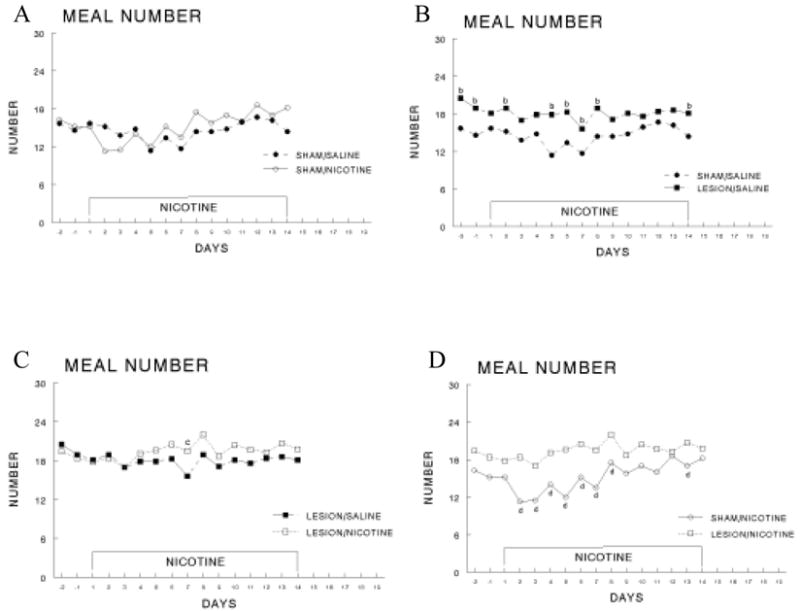
Previously we showed that intermittent administration of nicotine (NIC) in the dark phase decreased food intake and body weight and this could be blocked when the NIC receptor antagonist mecamylamine was infused into the fourth ventricle. Catecholaminergic neurons adjacent to the fourth ventricle contain NIC receptors and directly innervate the perifornical hypothalamus (PFH) which has been shown to be involved in regulation of feeding. This study explored whether NIC regulates feeding behavior by modulating catecholaminergic input to the PFH. Epinephrine and norepinephrine neuronal input was ablated within the PFH by infusion of 6-hydroxydopamine hydrobromide (6-OHDA), while bupropion was infused to protect dopaminergic neurons. After recovery of body weights to pre-surgery levels, food intake, meal size, meal number and body weight were measured after intermittent NIC injections. The results showed the PFH lesioned animals did not exhibit the typical prolonged drop in food intake, meal size and body weight normally associated with NIC administration. High performance liquid chromatography analyses demonstrated that compared to control rats, 6-OHDA administration significantly reduced PFH norepinephrine and epinephrine levels, but not dopamine levels. These results are consistent with NIC reducing food intake in part by acting through catecholaminergic neurons within or extending through the PFH.
Figures


Similar articles
-
Intermittent nicotine administration modulates food intake in rats by acting on nicotine receptors localized to the brainstem.Life Sci. 2004 Apr 16;74(22):2725-37. doi: 10.1016/j.lfs.2003.10.015. Life Sci. 2004. PMID: 15043987
-
Meal patterns in male rats during and after intermittent nicotine administration.Pharmacol Biochem Behav. 2003 Jan;74(2):495-504. doi: 10.1016/s0091-3057(02)01033-x. Pharmacol Biochem Behav. 2003. PMID: 12479972
-
Neonatal 6-hydroxydopamine lesions of the frontal cortex in rats: persisting effects on locomotor activity, learning and nicotine self-administration.Neuroscience. 2008 Jun 26;154(3):885-97. doi: 10.1016/j.neuroscience.2008.04.020. Epub 2008 Apr 16. Neuroscience. 2008. PMID: 18511204 Free PMC article.
-
Nicotinic Acetylcholine Receptor Signaling in the Hypothalamus: Mechanisms Related to Nicotine's Effects on Food Intake.Nicotine Tob Res. 2020 Feb 6;22(2):152-163. doi: 10.1093/ntr/ntz010. Nicotine Tob Res. 2020. PMID: 30690485 Free PMC article. Review.
-
Neurobiological mechanisms of nicotine's effects on feeding and body weight.Neurosci Biobehav Rev. 2025 Feb;169:106021. doi: 10.1016/j.neubiorev.2025.106021. Epub 2025 Jan 16. Neurosci Biobehav Rev. 2025. PMID: 39826824 Review.
Cited by
-
Regulation of bat echolocation pulse acoustics by striatal dopamine.J Exp Biol. 2011 Oct 1;214(Pt 19):3238-47. doi: 10.1242/jeb.058149. J Exp Biol. 2011. PMID: 21900471 Free PMC article.
-
Altered hypothalamic response to food in smokers.Am J Clin Nutr. 2013 Jan;97(1):15-22. doi: 10.3945/ajcn.112.043307. Epub 2012 Dec 12. Am J Clin Nutr. 2013. PMID: 23235196 Free PMC article.
-
Nicotinic regulation of energy homeostasis.Nicotine Tob Res. 2012 Nov;14(11):1270-90. doi: 10.1093/ntr/nts159. Epub 2012 Sep 18. Nicotine Tob Res. 2012. PMID: 22990212 Free PMC article. Review.
-
Heterogeneity of reward mechanisms.Neurochem Res. 2010 Jun;35(6):851-67. doi: 10.1007/s11064-009-0096-4. Epub 2009 Dec 12. Neurochem Res. 2010. PMID: 20012687 Review.
References
-
- Allen GV, Cechetto DF. Neurotensin in the lateral hypothalamic area: origin and function. Neuroscience. 1995;69(2):533–544. - PubMed
-
- Bellinger L, Cepeda-Benito A, Wellman PJ. Meal patterns in male rats during and after intermittent nicotine administration. Pharmacology Biochemistry and Behavior. 2003a;74(2):495–504. - PubMed
-
- Bellinger LL, Fabia R, Husberg BS. Meal patterns prior to and following liver transplantation in rats. Physiology and Behavior. 1997;62(3):525–529. - PubMed
-
- Bellinger LL, Mendel VE. Blood profile and balance study of rats given the putative anorectic agent satietin. American Journal of Physiology. 1995;268(1 Pt 2):R1–R7. - PubMed
-
- Bellinger LL, Mendel VE, Bernardis LL, Castonguay TW. Meal patterns of rats with dorsomedial hypothalamic nuclei lesions or sham operations. Physiology and Behavior. 1986;36(4):693–698. - PubMed
Publication types
MeSH terms
Substances
Grants and funding
LinkOut - more resources
Full Text Sources
Medical
