

doi: 10.1016/j.visres.2007.04.023.
Epub 2007 Jul 25.
Identification of novel retinal target genes of thyroid hormone in the human WERI cells by expression microarray analysis
Affiliations
- PMID: 17655910
- PMCID: PMC2932699
- DOI: 10.1016/j.visres.2007.04.023
Item in Clipboard
Identification of novel retinal target genes of thyroid hormone in the human WERI cells by expression microarray analysis
Vision Res.
2007 Aug.
Abstract
Using the human WERI-Rb1 cell line as a model system, we performed a genome-wide search for retinal target genes of thyroid hormone (TH) via expression microarray analysis followed by quantitative real-time RT-PCR verification. We identified 12 novel retinal targets of TH, including 10 up-regulated genes (OPN1MW, OPN1LW, TIMP3, RP1L1, GNGT2, CRX, ARR3, GCAP1, IMPDH1, and PDE6C) and 2 down-regulated genes (GNGT1 and GNB3). In addition, we found a number of novel TH-targets that are not currently known to be retinal genes. This is the first report of human retinal targets regulated by thyroid hormone.
Figures

RNA extracted from WERI cells was used to perform RT-PCR analysis using isoform-specific primers as described in Table 1. The predicted product size for TRα1 = 346 bp, TRα2 = 467 bp, TRβ1= 484 bp, TRβ2 = 307 bp, RXRα = 201 bp, RXRβ = 239 bp, RXRγ = 228 bp. * = TRβ1 PCR product size is smaller than predicted (484 bp). See text for explanation.
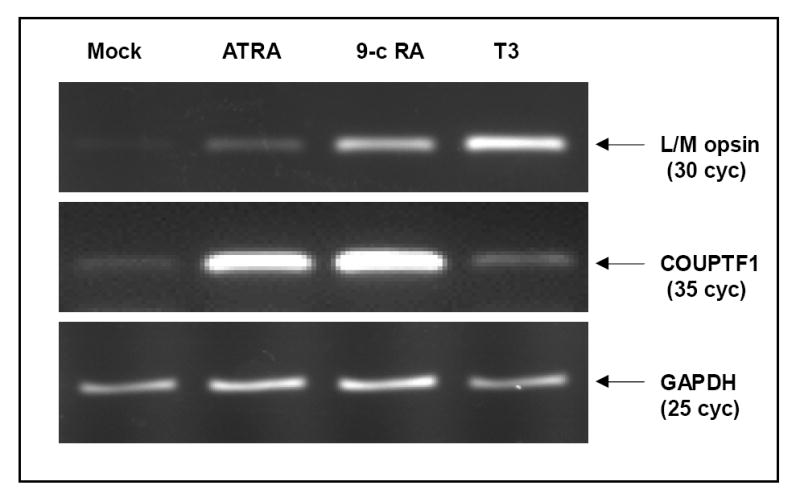
WERI cells were either treated with vehicle (mock), 10 uM all-trans retinoic acid (ATRA), 10 uM 9-cis retinoic acid (9c-RA), or 10 nM T3 (T3) for 48 hours. RNA extracted from these samples was used to perform RT-PCR analyses using primer pairs that amplify the L/M opsin gene (top panel), COUPTF1 (middle panel), or the housekeeping gene GAPDH (bottom panel).

(A). Scatter plot of hybridization signals of RNA from WERI cells treated with 100 nM T3 (TH, Y-axis) versus signals from a mock treated sample (Mock). Up-regulated transcripts are indicated by red + sign; down-regulated transcripts are indicated by green + sign; yellow + sign indicate transcripts with similar expression levels in the TH and Mock samples. (B). Scatter plot of p values (Y-axis) versus fold change (X-axis, log2 scale). The red + sign on the bottom left are transcripts down regulated by 4 fold or more with p value of ≤0.01 ; red + signs on the bottom right represent transcripts that are up-regulated by 4 fold or more with p values of ≤0.01. (C). Heatmap of probe sets on ±4 fold, p≤0.01 list generated by cluster analysis. Note the three biological replicates show similar levels of expression.

RNA samples used for microarray analysis mock (Mock) and 100 nM T3 (TH), were subjected to qRT-PCR to measure the expression levels of the 37 target genes identified by microarray analysis. The data for all 37 genes can be found in Table 4. This figure shows the amplification curves of 8 genes: GAPDH (used for normalization), LMOD1 (an up-regulated non-retinal gene), 5 up-regulated retinal genes (OPN1LW/MW, CRX, RP1L1, TIMP3 and GNGT2), and 1 down-regulated retinal gene (GNGT1). Each sample contains three biological replicates and was assayed in duplicate.

RNA samples from WERI cells treated for 48 hours with either vehicle control (No T3) or different concentrations of T3 (1nM, 10 nM, 100 nM) were used to perform qRT-PCR to measure the expression level of each gene as indicated. Fold inductions was calculated using the ddCt method which show the relative amount of each sample compared to the control (No T3). The data shown are normalized mean values ± SD of three biological replicates done in duplicate. Statistical analyses were performed using the Student’s t-test and compared the 1 nM group to the control group (No T3). The * sign indicates p≤0.05, ** sign indicates p≤0.01.

RNA samples from WERI cells treated with 5 nM T3 at different time points were used to perform qRT-PCR to measure the expression levels of each gene as indicated. GAPDH was also measured for normalization. Fold induction was calculated using the ddCt method which shows the relative amount of samples from each time point compared to the 0 time point. The data shown are normalized mean values ± SD of three biological replicates done in duplicate. F=fast, M=medium, S=slow.
Similar articles
-
Microarray analysis of gene expression in the aging human retina.Invest Ophthalmol Vis Sci. 2002 Aug;43(8):2554-60. Invest Ophthalmol Vis Sci. 2002. PMID: 12147584
-
Identification of novel genes preferentially expressed in the retina using a custom human retina cDNA microarray.Invest Ophthalmol Vis Sci. 2003 Sep;44(9):3732-41. doi: 10.1167/iovs.02-1080. Invest Ophthalmol Vis Sci. 2003. PMID: 12939286
-
Spatio-temporal characterization of retinal opsin gene expression during thyroid hormone-induced and natural development of rainbow trout.Vis Neurosci. 2006 Mar-Apr;23(2):169-79. doi: 10.1017/S0952523806232139. Vis Neurosci. 2006. PMID: 16638170
-
Making the gradient: thyroid hormone regulates cone opsin expression in the developing mouse retina.Proc Natl Acad Sci U S A. 2006 Apr 18;103(16):6218-23. doi: 10.1073/pnas.0509981103. Epub 2006 Apr 10. Proc Natl Acad Sci U S A. 2006. PMID: 16606843 Free PMC article.
-
Monogenic Retinal Diseases Associated With Genes Encoding Phototransduction Proteins: A Review.Clin Exp Ophthalmol. 2025 Apr;53(3):260-280. doi: 10.1111/ceo.14511. Epub 2025 Feb 27. Clin Exp Ophthalmol. 2025. PMID: 40013354 Free PMC article. Review.
Cited by
-
Cis-regulatory dissection of cone development reveals a broad role for Otx2 and Oc transcription factors.Development. 2021 May 1;148(9):dev198549. doi: 10.1242/dev.198549. Epub 2021 Apr 30. Development. 2021. PMID: 33929509 Free PMC article.
-
Transcriptional profiling of fibroblasts from patients with mutations in MCT8 and comparative analysis with the human brain transcriptome.Hum Mol Genet. 2010 Nov 1;19(21):4189-200. doi: 10.1093/hmg/ddq337. Epub 2010 Aug 12. Hum Mol Genet. 2010. PMID: 20705735 Free PMC article.
-
Minireview: the role of nuclear receptors in photoreceptor differentiation and disease.Mol Endocrinol. 2012 Jun;26(6):905-15. doi: 10.1210/me.2012-1010. Epub 2012 May 3. Mol Endocrinol. 2012. PMID: 22556342 Free PMC article. Review.
-
Mechanisms of Photoreceptor Patterning in Vertebrates and Invertebrates.Trends Genet. 2016 Oct;32(10):638-659. doi: 10.1016/j.tig.2016.07.004. Trends Genet. 2016. PMID: 27615122 Free PMC article. Review.
-
A component of retinal light adaptation mediated by the thyroid hormone cascade.PLoS One. 2011;6(10):e26334. doi: 10.1371/journal.pone.0026334. Epub 2011 Oct 24. PLoS One. 2011. PMID: 22039463 Free PMC article.
References
-
- Botzenhart EM, Green A, Ilyina H, Konig R, Lowry RB, Lo IF, Shohat M, Burke L, McGaughran J, Chafai R, Pierquin G, Michaelis RC, Whiteford ML, Simola KO, Rosler B, Kohlhase J. SALL1 mutation analysis in Townes-Brocks syndrome: twelve novel mutations and expansion of the phenotype. Hum Mutat. 2005;26(3):282. - PubMed
-
- Chen S, Wang QL, Nie Z, Sun H, Lennon G, Copeland NG, Gilbert DJ, Jenkins NA, Zack DJ. Crx, a novel Otx-like paired-homeodomain protein, binds to and transactivates photoreceptor cell-specific genes. Neuron. 1997;19(5):1017–1030. - PubMed
Publication types
MeSH terms
Substances
Grants and funding
LinkOut - more resources
Full Text Sources
Miscellaneous
