

Drivers of change in global agriculture
- PMID: 17656343
- PMCID: PMC2610166
- DOI: 10.1098/rstb.2007.2166
Drivers of change in global agriculture
Abstract
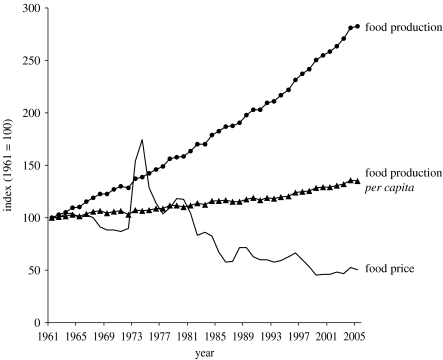
As a result of agricultural intensification, more food is produced today than needed to feed the entire world population and at prices that have never been so low. Yet despite this success and the impact of globalization and increasing world trade in agriculture, there remain large, persistent and, in some cases, worsening spatial differences in the ability of societies to both feed themselves and protect the long-term productive capacity of their natural resources. This paper explores these differences and develops a countryxfarming systems typology for exploring the linkages between human needs, agriculture and the environment, and for assessing options for addressing future food security, land use and ecosystem service challenges facing different societies around the world.
Figures
Similar articles
-
Population and natural resources: a statement.Earthwatch. 1984;(16):1-7. Earthwatch. 1984. PMID: 12339363
-
Strategies and models for agricultural sustainability in developing Asian countries.Philos Trans R Soc Lond B Biol Sci. 2008 Feb 27;363(1492):877-91. doi: 10.1098/rstb.2007.2189. Philos Trans R Soc Lond B Biol Sci. 2008. PMID: 17761471 Free PMC article. Review.
-
Human and ecosystem health: the environment-agriculture connection in developing countries.J Agromedicine. 1995;2(3):47-64. doi: 10.1300/J096v02n03_06. J Agromedicine. 1995. PMID: 12291328
-
Global warming, population growth, and natural resources for food production.Soc Nat Resour. 1991 Oct-Dec;4(4):347-63. doi: 10.1080/08941929109380766. Soc Nat Resour. 1991. PMID: 12344889
-
Towards Food Security: Current State and Future Prospects of Agrobiotechnology.Trends Biotechnol. 2018 Dec;36(12):1219-1229. doi: 10.1016/j.tibtech.2018.07.008. Epub 2018 Sep 24. Trends Biotechnol. 2018. PMID: 30262405 Review.
Cited by
-
Biological Control of Plant Pathogens: A Global Perspective.Microorganisms. 2022 Mar 9;10(3):596. doi: 10.3390/microorganisms10030596. Microorganisms. 2022. PMID: 35336171 Free PMC article. Review.
-
Modeling farmers' responsible environmental attitude and behaviour: a case from Iran.Environ Sci Pollut Res Int. 2019 Sep;26(27):28146-28161. doi: 10.1007/s11356-019-06040-x. Epub 2019 Jul 30. Environ Sci Pollut Res Int. 2019. PMID: 31363971
-
Identification of Mustard Aldehyde Dehydrogenase (ALDH) Gene Family and Expression Analysis Under Salt and Drought Stress.Genes (Basel). 2025 May 7;16(5):559. doi: 10.3390/genes16050559. Genes (Basel). 2025. PMID: 40428381 Free PMC article.
-
Mapping disruption and resilience mechanisms in food systems.Food Secur. 2020;12(4):695-717. doi: 10.1007/s12571-020-01093-0. Epub 2020 Aug 4. Food Secur. 2020. PMID: 32837660 Free PMC article.
-
The Global Food System as a Transport Pathway for Hazardous Chemicals: The Missing Link between Emissions and Exposure.Environ Health Perspect. 2017 Jan;125(1):1-7. doi: 10.1289/EHP168. Epub 2016 Jul 6. Environ Health Perspect. 2017. PMID: 27384039 Free PMC article.
References
-
- Adams R.M, Chen C, McCarl B.A, Weiher R.F. The economic consequences of ENSO events for agriculture. Clim. Res. 1999;13:165–172.
-
- Anderson J, Hazell P, Evans L. Variability in cereal yields: sources of change and implications for agricultural research and policy. Food Policy. 1987;12:199–212. doi:10.1016/0306-9192(77)90021-5 - DOI
-
- Barraclough S, Ghimire K. St Martin's Press, Inc; New York, NY: 1995. Forests and livelihoods: the social dynamics of deforestation in developing countries.
-
- Biggelaar D, Lal R, Wiebe K, Breneman V. Soil erosion impact on crop yields in North America. Adv. Agron. 2001;72:1–52.
-
- Bishop J, Allen J. Environment working paper 21. Environment Department, World Bank; Washington, DC: 1989. The on-site costs of soil erosion in Mali.
Publication types
MeSH terms
LinkOut - more resources
Full Text Sources
Other Literature Sources
Research Materials
