

Sustained CGRP1 receptor stimulation modulates development of EC coupling by cAMP/PKA signalling pathway in mouse skeletal myotubes
- PMID: 17656431
- PMCID: PMC2277057
- DOI: 10.1113/jphysiol.2007.137687
Sustained CGRP1 receptor stimulation modulates development of EC coupling by cAMP/PKA signalling pathway in mouse skeletal myotubes
Abstract
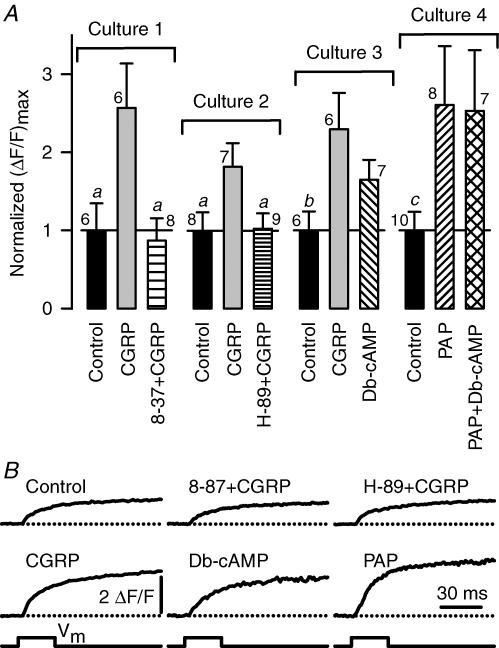
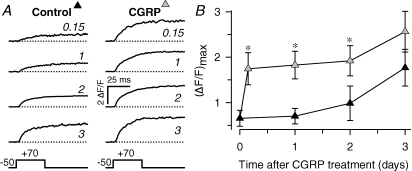
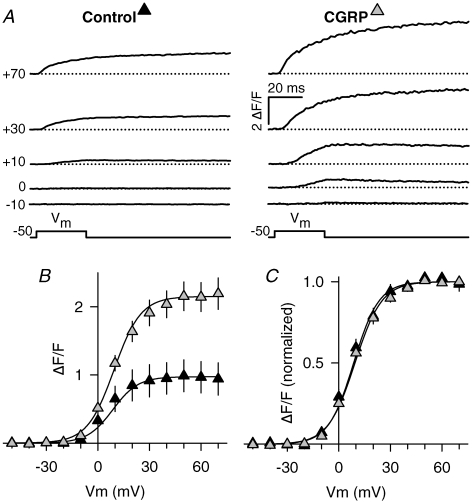
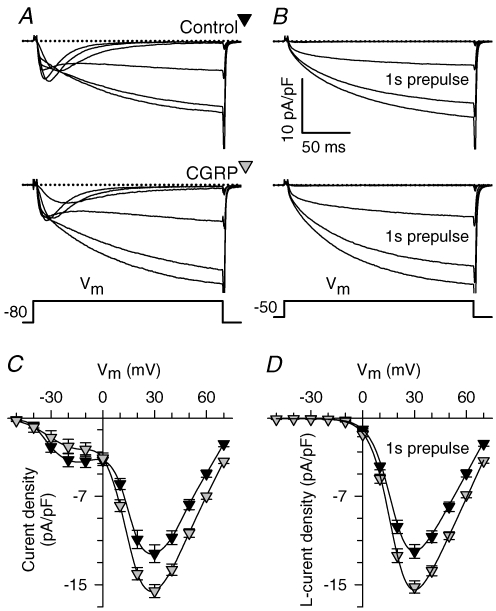
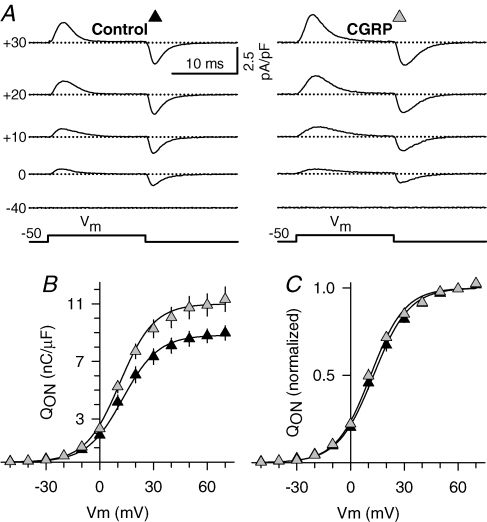
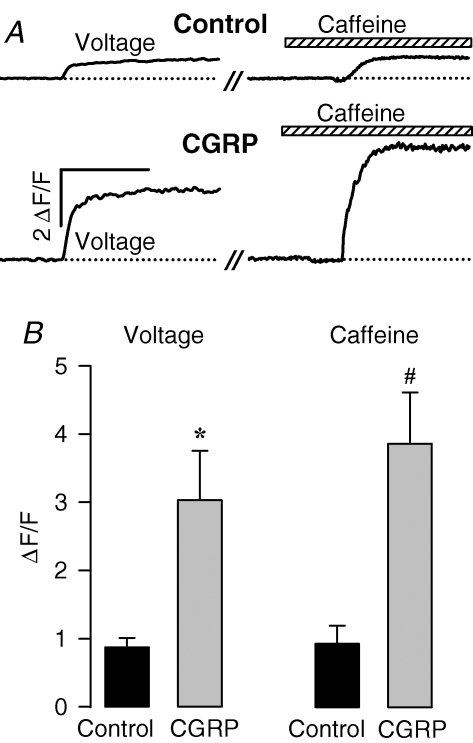
We investigated modulation of excitation-contraction (EC) coupling by calcitonin gene-related peptide (CGRP), which is released by motorneurons during neuromuscular transmission. Mouse skeletal myotubes were cultured either under control conditions or in the presence of 100 nm CGRP ( approximately 4-72 h). T- and L-type Ca(2+) currents, immobilization resistant charge movement, and intracellular Ca(2+) transients were characterized in whole-cell patch-clamp experiments. CGRP treatment increased the amplitude of voltage-gated Ca(2+) release ((DeltaF/F)(max)) approximately 75-350% and moderately increased both maximal L-current conductance (G(max)) and charge movement (Q(max)). In contrast, CGRP treatment did not affect their corresponding voltage dependence of activation (V(1/2) and k) or T-current density. CGRP treatment enhanced voltage-gated Ca(2+) release in approximately 4 h, whereas the effect on L-channel magnitude took longer to develop ( approximately 24 h), suggesting that short-term potentiation of EC coupling may lead to subsequent long-term up-regulation of DHPR expression. CGRP treatment also drastically increased caffeine-induced Ca(2+) release in approximately 4 h ( approximately 400%). Thus, short-term potentiation of EC coupling is due to an increase in sarcoplasmic reticulum Ca(2+) content. Both application of a phosphodiesterase inhibitor (papaverine) and a membrane-permeant cAMP analogue (Db-cAMP) produced a similar potentiation of EC coupling. Conversely, this potentiation was prevented by pretreatment with either CGRP1 receptor antagonist (CGRP(8-37)) or a PKA inhibitor (H-89). Thus, CGRP acts through CGRP1 receptors and the cAMP/PKA signalling pathway to enhance voltage-gated Ca(2+) release. Effects of CGRP on both EC coupling and L-channels were attenuated at later times during myotube differentiation. Therefore, we conclude that CGRP accelerates maturation of EC coupling.
Figures

Similar articles
-
Ca2+-dependent excitation-contraction coupling triggered by the heterologous cardiac/brain DHPR beta2a-subunit in skeletal myotubes.Biophys J. 2003 Dec;85(6):3739-57. doi: 10.1016/S0006-3495(03)74790-0. Biophys J. 2003. PMID: 14645065 Free PMC article.
-
Calcitonin gene-related peptide restores disrupted excitation-contraction coupling in myotubes expressing central core disease mutations in RyR1.J Physiol. 2011 Oct 1;589(Pt 19):4649-69. doi: 10.1113/jphysiol.2011.210765. Epub 2011 Aug 8. J Physiol. 2011. PMID: 21825032 Free PMC article.
-
The impact of ovariectomy on cardiac excitation-contraction coupling is mediated through cAMP/PKA-dependent mechanisms.J Mol Cell Cardiol. 2017 Oct;111:51-60. doi: 10.1016/j.yjmcc.2017.07.118. Epub 2017 Aug 1. J Mol Cell Cardiol. 2017. PMID: 28778766
-
CGRP, a vasodilator neuropeptide that stimulates neuromuscular transmission and EC coupling.Curr Vasc Pharmacol. 2010 May;8(3):394-403. doi: 10.2174/157016110791112287. Curr Vasc Pharmacol. 2010. PMID: 19485922 Review.
-
Bridging the myoplasmic gap: recent developments in skeletal muscle excitation-contraction coupling.J Muscle Res Cell Motil. 2007;28(4-5):275-83. doi: 10.1007/s10974-007-9118-5. Epub 2007 Sep 26. J Muscle Res Cell Motil. 2007. PMID: 17899404 Review.
Cited by
-
Chronic atrial ionic remodeling by aldosterone: potentiation of L-type Ca2+ channels and its arrhythmogenic significance.Pflugers Arch. 2016 Nov;468(11-12):1823-1835. doi: 10.1007/s00424-016-1876-8. Epub 2016 Sep 15. Pflugers Arch. 2016. PMID: 27631154
-
Characterization of the vagal motor neurons projecting to the Guinea pig airways and esophagus.Front Neurol. 2010 Dec 17;1:153. doi: 10.3389/fneur.2010.00153. eCollection 2010. Front Neurol. 2010. PMID: 21188271 Free PMC article.
-
α-Calcitonin gene-related peptide inhibits autophagy and calpain systems and maintains the stability of neuromuscular junction in denervated muscles.Mol Metab. 2019 Oct;28:91-106. doi: 10.1016/j.molmet.2019.06.024. Epub 2019 Jul 3. Mol Metab. 2019. PMID: 31331823 Free PMC article.
-
Effects of caffeine on metabolism and mitochondria biogenesis in rhabdomyosarcoma cells compared with 2,4-dinitrophenol.Nutr Metab Insights. 2012 Sep 13;5:59-70. doi: 10.4137/NMI.S10233. Print 2012. Nutr Metab Insights. 2012. PMID: 23882149 Free PMC article.
-
G protein-coupled receptor signaling via Src kinase induces endogenous human transient receptor potential vanilloid type 6 (TRPV6) channel activation.J Biol Chem. 2011 Apr 15;286(15):13184-92. doi: 10.1074/jbc.M110.183525. Epub 2011 Feb 24. J Biol Chem. 2011. PMID: 21349844 Free PMC article.
References
-
- Andersen SL, Clausen T. Calcitonin gene-related peptide stimulates active Na+-K+ transport in rat soleus muscle. Am J Physiol Cell Physiol. 1993;264:C419–C429. - PubMed
-
- Avila G, Dirksen RT. Rapamycin and FK506 reduce skeletal muscle voltage sensor expression and function. Cell Calcium. 2005;38:35–44. - PubMed
-
- Avila G, O'Connell KM, Groom LA, Dirksen RT. Ca2+ release through ryanodine receptors regulates skeletal muscle L-type Ca2+ channel expression. J Biol Chem. 2001;276:17732–17738. - PubMed
-
- Beam KG, Franzini-Armstrong C. Functional and structural approaches to the study of excitation-contraction coupling. Methods Cell Biol. 1997;52:283–306. - PubMed
-
- Boudreau-Lariviere C, Jasmin BJ. Calcitonin gene-related peptide decreases expression of acetylcholinesterase in mammalian myotubes. FEBS Lett. 1999;444:22–26. - PubMed
Publication types
MeSH terms
Substances
LinkOut - more resources
Full Text Sources
Research Materials
Miscellaneous