. 2007 Sep 15;583(Pt 3):1049-68.
doi: 10.1113/jphysiol.2007.137034. Epub 2007 Jul 26.

Spontaneous electrical and Ca2+ signals in typical and atypical smooth muscle cells and interstitial cell of Cajal-like cells of mouse renal pelvis

Affiliations

Spontaneous electrical and Ca2+ signals in typical and atypical smooth muscle cells and interstitial cell of Cajal-like cells of mouse renal pelvis

Richard J Lang et al. J Physiol. .

Abstract

Electrical rhythmicity in the renal pelvis provides the fundamental drive for the peristaltic contractions that propel urine from the kidney to bladder for storage until micturition. Although atypical smooth muscles (ASMCs) within the most proximal regions of the renal pelvis have long been implicated as the pacemaker cells, the presence of a sparsely distributed population of rhythmically active Kit-positive interstitial cells of Cajal-like cells (ICC-LCs) have confounded our understanding of pelviureteric peristalsis. We have recorded the electrical activity and separately visualized changes in intracellular Ca(2+) concentration in typical smooth muscle cells (TSMCs), ASMCs and ICC-LCs using intracellular microelectrodes and a fluorescent Ca(2+) indicator, fluo-4. Nifedipine (1-10 microm)-sensitive driven action potentials and Ca(2+) waves (frequency 6-15 min(-1)) propagated through the TSMC layer at a velocity of 1-2 mm s(-1). High frequency (10-40 min(-1)) Ca(2+) transients and spontaneous transient depolarizations (STDs) were recorded in ASMCs in the absence or presence of 1 microm nifedipine. ICC-LCs displayed low frequency (1-3 min(-1)) Ca(2+) transients which we speculated arose from cells that displayed action potentials with long plateaus (2-5 s). Neither electrical activity propagated over distances > 50 microm. In 1 microm nifedipine, ASMCs or ICC-LCs separated by < 30 microm displayed some synchronicity in their Ca(2+) transient discharge suggesting that they may well be acting as 'point sources' of excitation to the TSMC layer. We speculate that ASMCs act as the primary pacemaker in the renal pelvis while ICC-LCs play a supportive role, but can take over pacemaking in the absence of the proximal pacemaker drive.


Figures

Figure 1
Figure 1
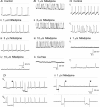
General electrical mechanical and morphological characteristics of the mouse renal pelvis A, intracellular microelectrode recordings of TSMC action potentials (Ai top panel) that were directly associated with muscle contraction (lower panel); dashed lines represent 0 mV. Aii, high frequency spontaneous transient depolarizations (STDs) not associated with muscle contractions were recorded in approximately 50% of impalements. Aiii, on eight occasions the recorded electrical activity was characterized by the presence of long plateau action potentials (at frequency of 1–3 min−1) which did not trigger muscle contraction. B, greyscale fluorescence micrographs of fixed whole mount preparations of proximal (Bi) and mid (Bii) renal pelvis immuno-stained for α-smooth muscle actin. Ci, fluorescence micrographs of unfixed whole mount preparations of mouse proximal renal pelvis exposed to FITC-dextran FD-70S to label macrophages (Cii) and then the extracellularly binding Kit antibody H-300 (Ci). Ciii, superposition of Ci+Cii revealed that only < 50% of Kit-positive cells also displayed the FITC-dextran fluorescence (arrows). Calibration bars represent 50 μm.
Figure 9
Figure 9
Summary of characteristics of electrical and Ca2+ signalling in TSMCs, ASMCs and ICC-LCs A, plots of mean interevent intervals against half-amplitude durations (1/2 width) of contractions (•) and TSMC action potentials (□) recorded in 5 preparations of the mouse renal pelvis. ○, a plot of the same parameters for Ca2+ waves recorded in 7 views from 4 preparations. B, plots of mean interevent intervals against 1/2 widths of TSMC action potentials (•) and long plateau action potentials (○) recorded simultaneously in 7 preparations. C, plot of mean interevent intervals against 1/2 widths of Ca2+ transients in ASMCs (•) and ICC-LCs (○) bathed in 1 μm nifedipine PSS in 7 preparations. D, comparison of mean interevent intervals of ASMCs and ICC-LCs (○) in 7 preparations. •, plot of mean interevent intervals of TSMC action potentials and contractions in 4 preparations for comparison. E, plots of peak cross-correlation factor (CCF) against separation distance (μm) between 32 pairs of ASMCs (Ei, N = 8) and ICC-LCs (Eii, N = 7). The straight line y = 0.284 + 0.000616x in Ei was fitted to pooled data by least squares regression.
Figure 3
Figure 3
Propagation of driven action potentials in longitudinally cut strip of renal pelvis Ai–iii, TSMC action potentials were recorded with two intracellular microelectrodes; V1 was held constant while V2 was moved to various positions along the longitudinal axis. B, plot of pooled intervals between action potential discharge recorded at V1 and V2 orientated along the longitudinal (•) and transverse (○) axes against the separation between V1 and V2 (10–2500 μm). The conduction velocity of 1.65 mm s−1 was obtained from the inverse of the slope of the straight line fitted to the pooled data obtained in the longitudinal axis. ▵, intervals versus separation plot for Ca2+ waves recorded in the TSMC layer for comparison.
Figure 2
Figure 2
Typical variation in recorded electrical activity in longitudinal preparations of mouse renal pelvis using single or pairs of intracellular microelectrodes A, the electrical activity at site b recorded with microelectrode V1 is compared with the electrical recordings at sites a, c and d recorded with a second microelectrode, V2. B, spontaneous action potentials could still be recorded in the distal portions of longitudinal preparations trisected into 3 equal sections. The frequency of driven action potential discharge in the most proximal section (Bia and iia) was little altered by the trisection, while the frequency of discharge in the most distal section was always less than the most proximal section (Biia and b).
Figure 4
Figure 4
Effects of ‘L-type’ Ca2+ channel blockade with nifedipine on TSMC action potentials, STDs and long plateau action potentials A, TSMC action potentials were either reduced by 1–10 μm nifedipine in a concentration dependent manner (Ai–iv) or completely blocked by 1 μm nifedipine (Ci and ii V1). B, STDs were little affected by nifedipine (1–10 μmBi–iii) but were blocked upon replacing the Ca2+ concentration in the bathing medium with an equimolar concentration of Mg2+ (Biv). C, long plateau action potentials recorded with V2 did not propagate over any appreciate distance (V1) and were little affected by 1 μm nifedipine, a concentration that readily blocked propagating TSMC action potentials (V1). D, in the presence of 1 μm nifedipine, residual action potentials triggered during the repolarizing phase of a large hyperpolarizing electrotonic potentials evoked at V2 readily propagated to V1.
Figure 5
Figure 5
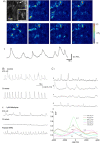
Ca2+ waves in the typical smooth muscle (TSMC) layer of the renal pelvis A, sequential Ca2+ fluorescence intensity micrographs of the fluo-4 loaded TSMC layer with time intervals of 66 ms observed at ×20 (Ai) or ×60 (Aii) magnification. The Ca2+ wave was clearly seen as a transient increase in Ca2+ intensity propagating across the field of view; the arrow indicates a single TSMC. Bi, superimposed fluorescence intensities of the 3 regions (a–c) in Ai top panel plotted against time. Bii, cross-correlogram of the Ca2+ wave recorded at a and c (separation 110 μm) show a high degree of 1 : 1 synchronicity. C, Ca2+ waves recorded at 2 positions in a field of view (Ci) were reduced but not blocked upon exposure to 1 μm nifedipine (Cii). In other fields of view in the same preparation, Ca2+ waves in the TSMC layer were completely blocked by 1 μm nifedipine.
Figure 6
Figure 6
Ca2+ transients in atypical smooth muscle cells (ASMCs) of the renal pelvis A, greyscale micrograph of fluo-4 loaded ASMCs; arrows indicate single ASMCs. Bi–iv sequential fluorescence intensity micrographs of 4 ASMCs (a–d) and a Ca2+ wave in the TMSC layer (e) taken at intervals of 1 s (arrow indicates direction of Ca2+ wave). C, Ca2+ fluorescence intensities for the 4 ASMCs (a–d) illustrated in B plotted against time reveals that the Ca2+ transients in these cells had no temporal relationship with the Ca2+ wave. D, Ca2+ transients recorded in 2 ASMCs (Di upper panels) were little affected by 1 μm nifedipine, which reduced Ca2+ waves in the TSMC layer (Dii lower panel).
Figure 7
Figure 7
STDs and Ca2+ transients in ASMCs do not propagate Ai–viii, sequential Ca2+ fluorescence micrographs of 4 ASMCs (a–d) taken at intervals of 300 ms. Bi, Ca2+ fluorescence intensity of the 4 cells (a–d) illustrated in A plotted against time. Bii, cross-correlagrams of the four cells (a–d) plotted in Bi reveals little 1 : 1 synchronicity except when cells (a–b and b–c) were separated by < 30 μm. C, in 1 μm nifedipine, STDs recorded with one microelectrode (V1) were not recorded by a second microelectrode (V2) situated 50–60 μm along the longitudinal (Ci) or transverse (Cii) axis.
Figure 8
Figure 8
Ca2+ transients in ICC-LCs A, sequential Ca2+ fluorescence micrographs of fusiform shaped ICC-LC (arrow indicates cell in inset) taken at intervals of 1 s. B, Ca2+ fluorescence intensity of TSMC Ca2+ wave and ICC-LCs plotted against time in the absence (Bi) and presence (Bii) of 1 μm nifedipine. Ci, Ca2+ fluorescence intensity of 4 ICC-LCs (a–d) in a field of view plotted against time. Cii, cross-correlagrams of the four cells (a–d) plotted in Ci reveals that ICC-LCs were not firing synchronicity except when separated by < 30 μm (a–d and b–c).
Figure 10
Figure 10
Effects of a gap junction uncoupler, 18β-glycyrrhetinic acid (18β-GA) A, propagating action potentials recorded with a pair of intracellular microelectrodes (V1 and V2 < 50 μm apart) were blocked by 50 μm 18β-GA in a manner associated with a reduced amplitude of the electrotonic potentials recorded at V1 in response to a large hyperpolarizing current applied to V2 (Bi and ii). C, 18β-GA (50 μm) rapidly blocked propagating Ca2+ waves in the TSMC layer (Ci and ii) as well as the Ca2+ transients recorded in ASMCs (Ciii and iv).
Figure 11
Figure 11
Schematic representation of the mouse pelviureteric system and relationships between ASMCs, TSMCs and ICC-LCs A, diagram illustrating the gross morphology of the pelviureteric system and the regions of the pelvi-calyceal junction (PCJ), proximal renal pelvis (Prox. RP), and the ureteropelvic junction consisting of the distal renal pelvis (Dist. RP) and ureter. Shaded areas represent typical positions of the longitudinally (L) and transversely (T) cut strips of renal pelvis dissected for experimentation. B, schematic cross sectional diagram of the proximal renal pelvis illustrating the distribution and interconnectivity of TSMCs, ASMCs and ICC-LCs, blood vessels (BV), nerve bundles (N), lamina propria (LP) and urothelium. C, relative distribution of ASMCs, TSMCs and ICC-LCs along the mammalian pelviureteric system.

Similar articles

Cited by

References

    1. Constantinou CE, Neubarth JL, Mensah-Dwumah M. Frequency gradient in the autorhythmicity of the pyeloureteral pacemaker system. Experientia. 1978;34:614–615. - PubMed
    1. Cousins HM, Edwards FR, Hickey H, Hill CE, Hirst GDS. Electrical coupling between the myenteric interstitial cells of Cajal and adjacent muscle layers in the guinea-pig gastric antrum. J Physiol. 2003;550:829–844. - PMC - PubMed
    1. David SG, Cebrian C, Vaughan ED, Herzlinger D. C-kit and ureteral peristalsis. J Urol. 2005;173:292–295. - PubMed
    1. Dickens EJ, Hirst GDS, Tomita T. Identification of rhythmically active cells in guinea-pig stomach. J Physiol. 1999;514:515–531. - PMC - PubMed
    1. Dixon JS, Gosling JA. The fine structure of pacemaker cells in the pig renal calices. Anat Rec. 1973;175:139–153. - PubMed

Publication types

MeSH terms

LinkOut - more resources