

Short interval intracortical inhibition and facilitation during the silent period in human
- PMID: 17656435
- PMCID: PMC2277199
- DOI: 10.1113/jphysiol.2007.135749
Short interval intracortical inhibition and facilitation during the silent period in human
Abstract
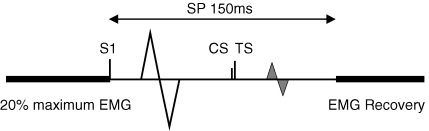
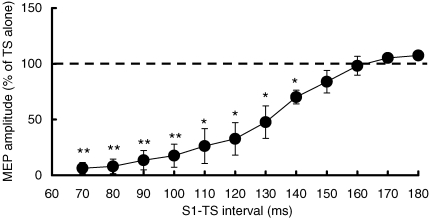
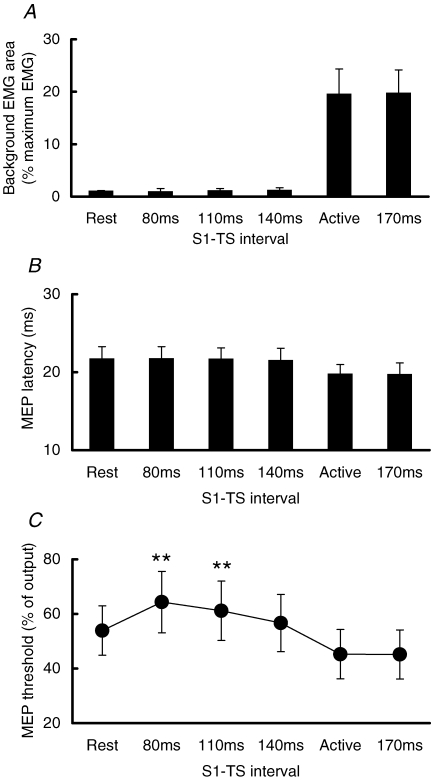
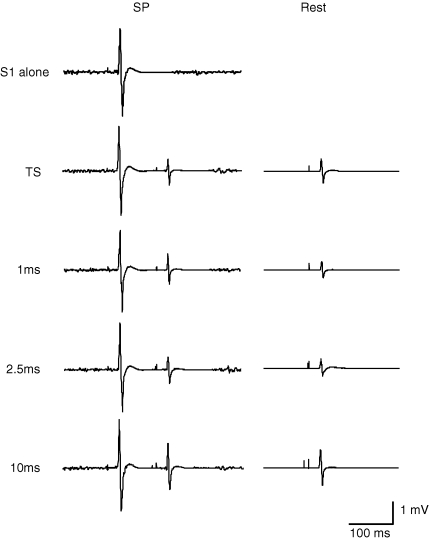
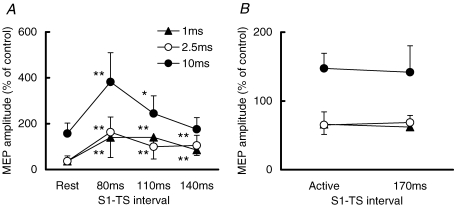
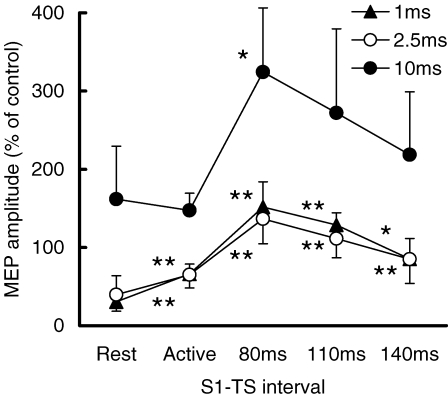
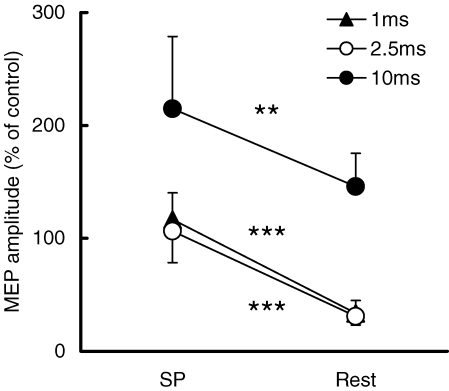
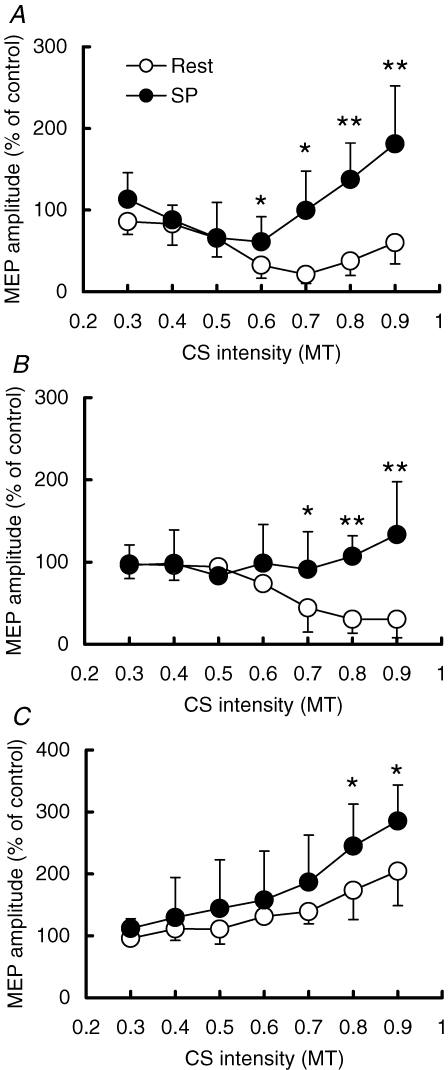
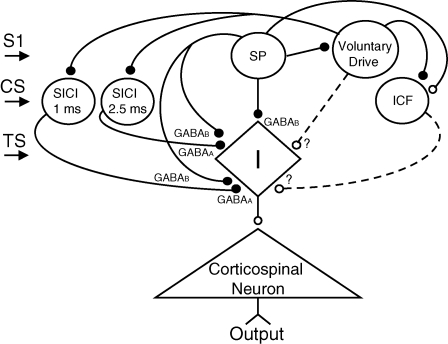
Following a suprathreshold transcranial magnetic stimulation (TMS) to the primary motor cortex (M1) during voluntary muscle contraction, a motor evoked potential (MEP) occurs in the target muscle followed by a silent period (SP) in the electromyographic (EMG) activities. The present study investigated how short interval intracortical inhibition (SICI) and intracortical facilitation (ICF) change during the SP. The time course of MEP and motor threshold during the SP were examined in the right first dorsal interosseous muscle. Using a triple-pulse protocol, SICI and ICF were tested at different times during the SP. The effects of different intensities of the conditioning stimulation (CS) for SICI and ICF were also investigated during the SP and at rest. During the SP, MEP was inhibited and motor threshold was increased, whereas MEP latency and background EMG level were same as those at rest. SICI decreased during the SP over a wide range of CS intensities. ICF increased at higher CS intensity. We conclude that SICI is suppressed and ICF is facilitated during the SP and the effects are separate from the interruption of voluntary drive.
Figures
Similar articles
-
Muscle pain differentially modulates short interval intracortical inhibition and intracortical facilitation in primary motor cortex.J Pain. 2012 Feb;13(2):187-94. doi: 10.1016/j.jpain.2011.10.013. Epub 2012 Jan 9. J Pain. 2012. PMID: 22227117 Clinical Trial.
-
Relaxation from a voluntary contraction is preceded by increased excitability of motor cortical inhibitory circuits.J Physiol. 2004 Jul 15;558(Pt 2):685-95. doi: 10.1113/jphysiol.2004.064774. Epub 2004 Jun 4. J Physiol. 2004. PMID: 15181164 Free PMC article.
-
Modulation of the cortical silent period elicited by single- and paired-pulse transcranial magnetic stimulation.BMC Neurosci. 2013 Apr 2;14:43. doi: 10.1186/1471-2202-14-43. BMC Neurosci. 2013. PMID: 23547559 Free PMC article.
-
Myths and Methodologies: How loud is the story told by the transcranial magnetic stimulation-evoked silent period?Exp Physiol. 2019 May;104(5):635-642. doi: 10.1113/EP087557. Epub 2019 Mar 24. Exp Physiol. 2019. PMID: 30830992 Review.
-
Measurement of voluntary activation based on transcranial magnetic stimulation over the motor cortex.J Appl Physiol (1985). 2016 Sep 1;121(3):678-86. doi: 10.1152/japplphysiol.00293.2016. Epub 2016 Jul 14. J Appl Physiol (1985). 2016. PMID: 27418687 Review.
Cited by
-
Transcutaneous spinal direct current stimulation modulates human corticospinal system excitability.J Neurophysiol. 2015 Jul;114(1):440-6. doi: 10.1152/jn.00490.2014. Epub 2015 Apr 29. J Neurophysiol. 2015. PMID: 25925328 Free PMC article.
-
Transcranial Magnetic Stimulation and Neocortical Neurons: The Micro-Macro Connection.Front Neurosci. 2022 Apr 12;16:866245. doi: 10.3389/fnins.2022.866245. eCollection 2022. Front Neurosci. 2022. PMID: 35495053 Free PMC article. Review.
-
Area 5 influences excitability within the primary motor cortex in humans.PLoS One. 2011;6(5):e20023. doi: 10.1371/journal.pone.0020023. Epub 2011 May 16. PLoS One. 2011. PMID: 21603571 Free PMC article.
-
Comparative Study of a Continuous Train of Theta-Burst Stimulation for a Duration of 20 s (cTBS 300) versus a Duration of 40 s (cTBS 600) in a Pre-Stimulation Relaxed Condition in Healthy Volunteers.Brain Sci. 2021 Jun 1;11(6):737. doi: 10.3390/brainsci11060737. Brain Sci. 2021. PMID: 34205963 Free PMC article.
-
Low-Frequency Repetitive Transcranial Magnetic Stimulation Targeted to Premotor Cortex Followed by Primary Motor Cortex Modulates Excitability Differently Than Premotor Cortex or Primary Motor Cortex Stimulation Alone.Neuromodulation. 2015 Dec;18(8):678-85. doi: 10.1111/ner.12337. Epub 2015 Aug 26. Neuromodulation. 2015. PMID: 26307511 Free PMC article. Clinical Trial.
References
-
- Butefisch CM, Netz J, Wessling M, Seitz RJ, Homberg V. Remote changes in cortical excitability after stroke. Brain. 2003;126:470–481. - PubMed
-
- Chen R, Garg R. Facilitatory I wave interaction in proximal arm and lower limb muscle representations of the human motor cortex. J Neurophysiol. 2000;83:1426–1434. - PubMed
-
- Chen R, Lozano AM, Ashby P. Mechanism of the silent period following transcranial magnetic stimulation. Evidence from epidural recordings. Exp Brain Res. 1999;128:539–542. - PubMed
-
- Chen R, Tam A, Bütefisch C, Corwell B, Ziemann U, Rothwell JC, Cohen LG. Intracortical inhibition and facilitation in different representations of the human motor cortex. J Neurophysiol. 1998;80:2870–2881. - PubMed
-
- Chen R, Wassermann EM, Caños M, Hallett M. Impaired inhibition in writer's cramp during voluntary muscle activation. Neurology. 1997;49:1054–1059. - PubMed
Publication types
MeSH terms
LinkOut - more resources
Full Text Sources