. 2007 Aug;16(8):1628-40.
doi: 10.1110/ps.072865407.

The structure of receptor-associated protein (RAP)

Affiliations

The structure of receptor-associated protein (RAP)

Donghan Lee et al. Protein Sci. 2007 Aug.

Abstract

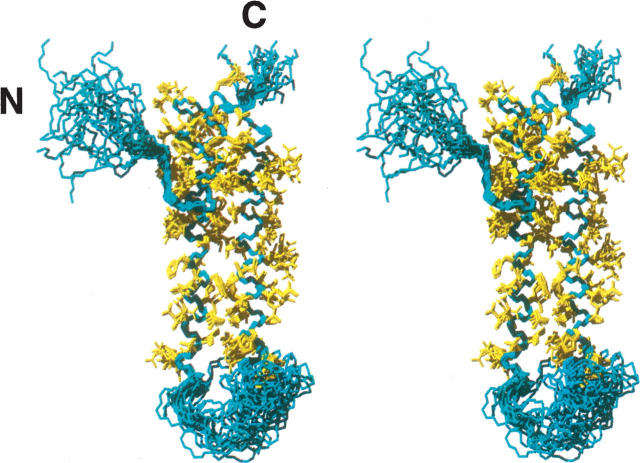
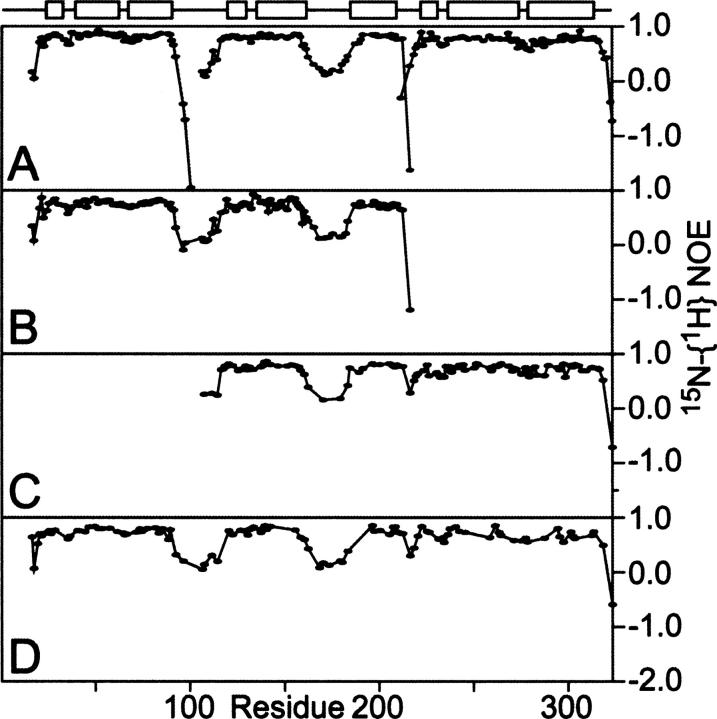
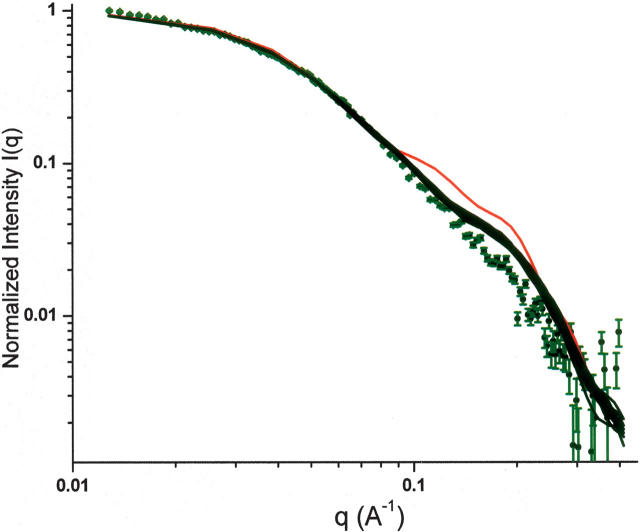
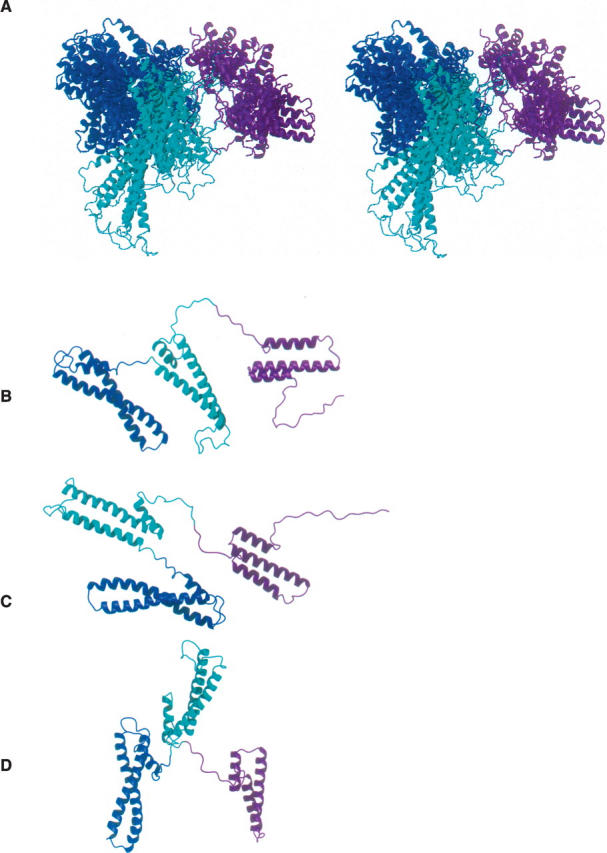
The receptor-associated protein (RAP) is a molecular chaperone that binds tightly to certain newly synthesized LDL receptor family members in the endoplasmic reticulum (ER) and facilitates their delivery to the Golgi. We have adopted a divide-and-conquer strategy to solve the structures of the individual domains of RAP using NMR spectroscopy. We present here the newly determined structure of domain 2. Based on this structure and the structures of domains 1 and 3, which were solved previously, we utilized experimental small-angle neutron scattering (SANS) data and a novel simulated annealing protocol to characterize the overall structure of RAP. The results reveal that RAP adopts a unique structural architecture consisting of three independent three-helix bundles that are connected by long and flexible linkers. The flexible linkers and the quasi-repetitive structural architecture may allow RAP to adopt various possible conformations when interacting with the LDL receptors, which are also made of repetitive substructure units.


Figures

Figure 1.
Figure 1.
Stereoview of the backbone atoms of the 20 lowest-energy conformers representing the solution structure of D2. Residues 117–208, excluding a flexible loop (residues 162–183), are used for a superposition for minimal RMSD of the backbone atoms. The polypeptide backbones are colored in cyan. The heavy atoms of side chains from the superimposed residues are shown in yellow. The N- and C-termini are indicated.
Figure 2.
Figure 2.
D1 and D2 compete for the binding of 125I-labeled D1D2 to LRP. LRP was immobilized in microtiter wells, and incubated with 125I-labled D1D2 in the presence of indicated concentrations of unlabeled D1D2 (closed down-facing triangles), D1 (closed circles), or D2 (open circles). Error bars were derived from duplicated sets of the experiments.
Figure 3.
Figure 3.
Binding of 125I-labeled D1D2 WT and mutants to LRP immobilized on microtiter wells. The data were fit to a single class of sites using LIGAND (Munson and Rodbard 1980), which gave K D values of 3.4, 7.6, 30, and 125 nM for D1D2 WT, R76A/R79A, K191A/R195A, and R76A/R79A K191A/R195A, respectively. Error bars were derived from the duplicated sets of the experiments.
Figure 4.
Figure 4.
The three domains of RAP fold independently. Comparison of [15N,1H]-TROSY spectra of uniformly 15N,2H,13C-labeled full-length RAP (A) or individual domains superimposed and color coded (magenta for D1, cyan for D2, and blue for D3) (B). Domain construct boundaries are D1 (residues 1–100); D2 (residues 101–216); and D3 (residues 206–323). The [15N,1H]-TROSY spectra were measured with different numbers of scans, and polarization transfer times were optimized (2.7 ms for domain constructs and 2.2 ms for the full-length RAP) for a maximum signal-to-noise ratio for amino groups. The spectrum of full-length RAP was plotted at a low contour level to show as many peaks as possible, including very weak ones, for comparing patterns in the spectra. The comparison shows that the chemical-shift changes between the individual domains and the full-length RAP are insignificant except for the residues in the ends of the domains. The constructs of D2 and D3 have a sequence overlap (residues 206–216). (C, D, E) Amide proton (ΔδH), 15N (ΔδN), and the combined (Δδav) chemical-shift difference between the full-length RAP and its individual domains, respectively. The combined chemical-shift difference was calculated using the formula Δδav = 0.5[ΔδH 2 + (0.2ΔδN)2]0.5 (Pellecchia et al. 1999). The schematic drawing on the top of panel C is the secondary structure of RAP, with boxes and lines representing α-helices and linkers between helices, respectively. For the overlapped peaks, the chemical-shift positions were taken from HNCA spectra, where ∼65% of the amide peaks of the full-length RAP are resolved. All spectra were recorded on a Bruker AVANCE spectrometer operating at a proton frequency of 600 MHz under the same conditions (ca. 1.0 mM-labeled proteins in 95% H2O/5% 2H2O, pH 7.25, 30°C).
Figure 5.
Figure 5.
Comparison of chemical shifts of the tandem domains (D12 and D23) and the full-length RAP [1HN (A), 15N (B), and Δδav (C) for D12; 1HN (E), 15N (F), and Δδav (G) for D23]. At the top, the regular secondary structure elements of the full-length RAP are indicated schematically. The chemical-shift differences in the linker regions are <0.05 ppm, suggesting the structures of linkers together with the rest of the protein remain unchanged from the individual domains, the tandem domains to the full-length proteins.
Figure 6.
Figure 6.
Comparison of 15N-{1H} NOEs of the individual domains (A) and the tandem domains D12 (B) and D23 (C), and full-length RAP (D). At the top, the regular secondary structure elements are indicated schematically. The NOE values are similar for both the structured regions as well as linker regions among different constructs. The NOE values of the linker regions are <0.5, characteristic of flexible structures.
Figure 7.
Figure 7.
Comparison of the experimental and back-calculated SANS curves: green with error bars, experimental data from RAP at 5 mg/mL concentration in D2O buffer; red, Rg-refined structure with Rg = 35 Å; black, the 20 lowest-energy SANS-refined structures.
Figure 8.
Figure 8.
Ribbon diagrams of the 10 lowest-energy SANS-refined in stereoview (A); two examples of the SANS-refined structures (B, C); and ribbon drawing of the Rg-refined (D). Color code: magenta, cyan, and blue for D1, D2, and D3, respectively. The detailed protocol used for the calculation is provided in the Supplemental material. The average χ2 values between the experimental and calculated results based on the SANS-refined and R g-refined structures are ∼8 and 37, respectively. It is noteworthy that the length of RAP can reach >150 Å when the linkers are fully extended. Note that the main structural differences shown in C and D are the relative positions of D2 and D3. The spatial resolution of the experimental SANS curve is ∼40 Å at q ≈ 0.15 Å.

Similar articles

Cited by

References

    1. Bax A., Kontaxis, G., and Tjandra, N. 2001. Dipolar couplings in macromolecular structure determination. In Nuclear magnetic resonance of biological macromolecules (eds. T.L. James, V. Dotsch, and U. Schmitz), pp. 127–174. Academic Press, San Diego, CA. Part B. - PubMed
    1. Bewley C.A. and Clore, G.M. 2000. Determination of the relative orientation of the two halves of the domain-swapped dimer of cyanovirin-N in solution using dipolar couplings and rigid body minimization. J. Am. Chem. Soc. 122: 6009–6016.
    1. Boucher P., Gotthardt, M., Li, W.P., Anderson, R.G.W., and Herz, J. 2003. LRP: Role in vascular wall integrity and protection from atherosclerosis. Science 300: 323–329. - PubMed
    1. Bu G., Geuze, H.J., Strous, G.J., and Schwartz, A.L. 1995. 39 kDa receptor-associated protein is an ER resident protein and molecular chaperone for LDL receptor-related protein. EMBO J. 14: 2269–2280. - PMC - PubMed
    1. Cantor C.R. and Schimmel, P.R. 1980. Biophysical chemistry, Part III: The behavior of biological macromolecules. W.H. Freeman and Company, New York.

Publication types

MeSH terms

Substances

LinkOut - more resources