Comparative Study
. 2007 Aug;117(8):2216-24.
doi: 10.1172/JCI32057.

Macrophage ABCA1 and ABCG1, but not SR-BI, promote macrophage reverse cholesterol transport in vivo

Affiliations
Comparative Study

Macrophage ABCA1 and ABCG1, but not SR-BI, promote macrophage reverse cholesterol transport in vivo

Xun Wang et al. J Clin Invest. 2007 Aug.

Abstract

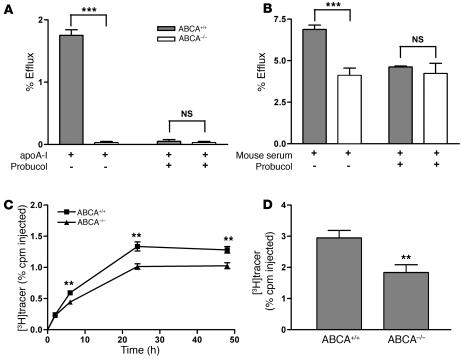
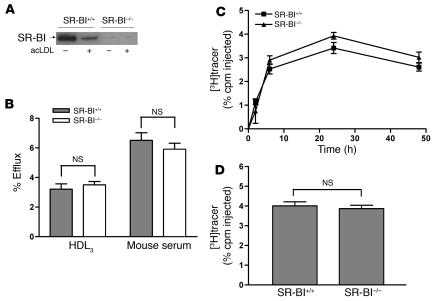
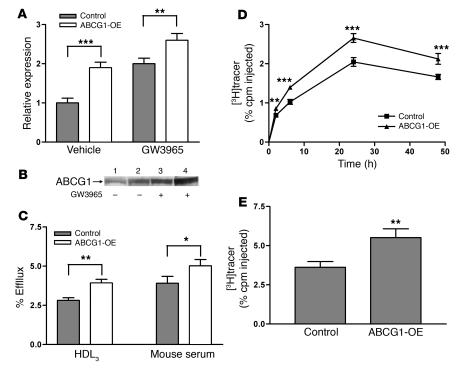
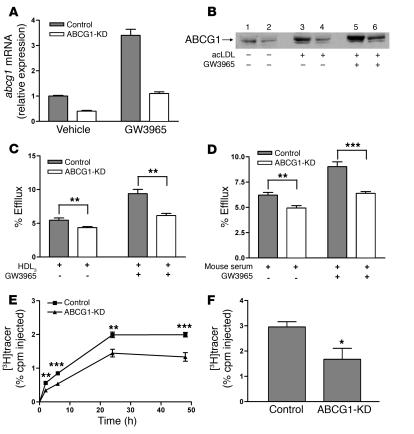
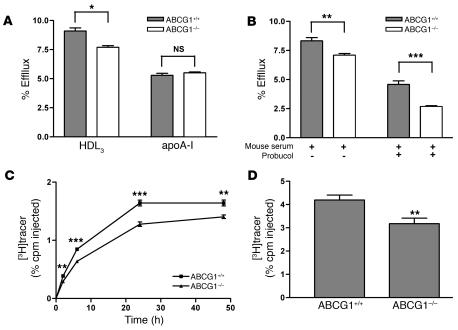
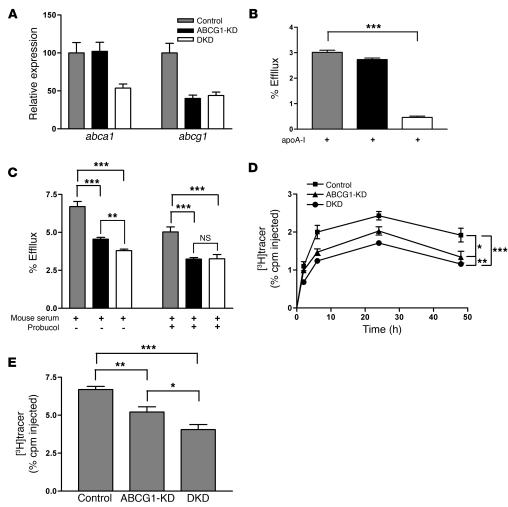
Macrophage ATP-binding cassette transporter A1 (ABCA1), scavenger receptor class B type I (SR-BI), and ABCG1 have been shown to promote cholesterol efflux to extracellular acceptors in vitro and influence atherosclerosis in mice, but their roles in mediating reverse cholesterol transport (RCT) from macrophages in vivo are unknown. Using an assay of macrophage RCT in mice, we found that primary macrophages lacking ABCA1 had a significant reduction in macrophage RCT in vivo, demonstrating the importance of ABCA1 in promoting macrophage RCT, however substantial residual RCT exists in the absence of macrophage ABCA1. Using primary macrophages deficient in SR-BI expression, we found that macrophage SR-BI, which was shown to promote cholesterol efflux in vitro, does not contribute to macrophage RCT in vivo. To investigate whether macrophage ABCG1 is involved in macrophage RCT in vivo, we used ABCG1-overexpressing, -knockdown, and -knockout macrophages. We show that increased macrophage ABCG1 expression significantly promoted while knockdown or knockout of macrophage ABCG1 expression significantly reduced macrophage RCT in vivo. Finally, we show that there was a greater decrease in macrophage RCT from cells where both ABCA1 and ABCG1 expression were knocked down than from ABCG1-knockdown cells. These results demonstrate that ABCA1 and ABCG1, but not SR-BI, promote macrophage RCT in vivo and are additive in their effects.


Figures

Figure 1
Figure 1. ABCA1-deficient BMMs have reduced cholesterol efflux ex vivo and RCT in vivo.
(A) BMMs from WT (ABCA1+/+) or ABCA1-KO (ABCA1–/–) mice were labeled with [3H]cholesterol and loaded with 25 μg/ml acLDL for 24 hours. Cells were equilibrated for 18 hours in the presence of 1 μM LXR agonist (GW3965). Then, cells were incubated for 2 hours in either the presence of absence of probucol (20 μM). Cholesterol efflux was determined in the presence of lipid-free apoA-I (10 μg/ml) for 2 hours. Data are expressed as mean ± SD; n = 3. ***P < 0.001. (B) Cholesterol efflux was determined as described above, except 2.5% mouse whole serum was used as the acceptor. Data are expressed as mean ± SD; n = 3. ***P < 0.001. (C and D) For the in vivo RCT experiment, WT C57BL/6 mice that had been treated with an LXR agonist for 2 weeks were injected i.p. with [3H]cholesterol-labeled, acLDL-loaded, and LXR agonist–treated BMMs from ABCA1+/+ or ABCA1–/– mice. Mice were bled at 2, 6, 24, and 48 hours after injection. n = 8 mice per group. Data are expressed as the percentage of tracer relative to total cpm tracer injected ± SEM. **P < 0.01. Results are representative of 2 independent experiments. (C) Time course of [3H]cholesterol distribution in plasma. Individual time points and areas under the curve were determined and compared. (D) Fecal [3H]tracer levels. Feces were collected continuously from 0 to 48 hours.
Figure 2
Figure 2. SR-BI–deficient BMMs have normal cholesterol efflux ex vivo and RCT in vivo.
(A) Western blotting demonstrating the absence of SR-BI protein expression in SR-BI–/– macrophages. SR-BI was detected by Western blotting with anti–SR-BI antibody. Equal amounts of total proteins were loaded. (B) Mouse BMMs from WT (SR-BI+/+) and SR-BI–/– mice were labeled with [3H]cholesterol for 24 hours. After equilibration in 0.2% BSA overnight, macrophages were incubated with either 25 μg/ml HDL3 or 2.5% mouse whole serum for 2 hours. Values are mean ± SD; n = 3. Results are representative of 2 independent experiments. (C and D) The RCT experiment was performed as described in Figure 1 for SR-BI+/+ and SR-BI–/– BMMs, except that cells were not loaded with acLDL and neither cells nor mice were treated with GW3965. n = 6 mice per group. Data are expressed as the percentage of tracer relative to total cpm tracer injected ± SEM. Results are representative of 2 independent experiments. (C) Time course of [3H]cholesterol distribution in plasma. (D) Fecal [3H]tracer levels. Feces were collected continuously from 0 to 48 hours.
Figure 3
Figure 3. Overexpression of ABCG1 in J774 macrophages promotes cholesterol efflux in vitro and RCT in vivo.
(A) Quantitative analysis of mRNA expression of abcg1 in ABCG1-OE and control cells by quantitative RT-PCR. Total RNA was extracted from cells that were treated with either vehicle or GW3965 (1 μM) for 24 hours. Data are expressed as fold change ± SD and normalized to mouse 18S rRNA. **P < 0.01; ***P < 0.001. (B) Western blot demonstrating the overexpression of ABCG1. Control and ABCG1-OE cells were grown in either the absence or presence of GW3965 as indicated. ABCG1 was detected by Western blotting with anti-ABCG1 antibody. Equal amount of total proteins were loaded. Lanes 1 and 3 represent control cells. Lanes 2 and 4 represent ABCG1-OE cells. (C) Cholesterol efflux assay was performed as described in Figure 1. Cholesterol efflux was determined in the presence of HDL3 (25 μg/ml) or 2.5% mouse whole serum for 4 hours. Data are expressed as mean ± SD; n = 3. *P < 0.05; **P < 0.01. (D and E) The RCT experiment was done as described in Figure 1 with [3H]cholesterol-labeled, acLDL-loaded, and LXR agonist–treated J774 control macrophages and ABCG1-OE macrophages. n = 8 mice per group. Data are expressed as the percentage of tracer relative to total cpm tracer injected ± SEM. **P < 0.01; ***P < 0.001. (D) Time course of [3H]cholesterol distribution in plasma. Individual time points and areas under the curve were determined and compared. (E) Fecal [3H]tracer levels. Feces were collected continuously from 0 to 48 hours.
Figure 4
Figure 4. Knockdown of ABCG1 in J774 macrophages reduces cholesterol efflux in vitro and RCT in vivo.
(A) Quantitative analysis of mRNA expression of abcg1 in ABCG1-KD and control cells by quantitative RT-PCR. Total RNA was extracted from cells that were treated with either vehicle or 1 μM GW3965 for 24 hours. Data are expressed as fold change ± SD and normalized to mouse 18S rRNA. (B) Western blotting demonstrating the knockdown of ABCG1 protein expression. Control and ABCG1-KD cells were treated with either acLDL or GW3965. ABCG1 was detected by Western blotting with anti-ABCG1 antibody. Equal amount of total proteins were loaded. Lanes 1, 3, and 5 represent control cells. Lanes 2, 4, and 6 represent ABCG1-KD cells. (C and D) Cholesterol efflux assay was performed as described in Figure 1 in the presence of HDL3 (25 μg/ml) or 2.5% mouse whole serum for 4 hours. Data are expressed as mean ± SD; n = 3. **P < 0.01; ***P < 0.001. (E and F) The RCT experiment was performed as described in Figure 1 with [3H]cholesterol-labeled, acLDL-loaded, and LXR agonist–treated J774 control macrophages and ABCG1-KD macrophages. n = 8 mice per group. Data are expressed as the percentage of tracer relative to total cpm tracer injected ± SEM. *P < 0.05; **P < 0.01; ***P < 0.001. Results are representative of 3 independent experiments. (E) Time course of [3H]cholesterol distribution in plasma. Individual time points and areas under the curve were determined and compared. (F) Fecal [3H]tracer levels. Feces were collected continuously from 0 to 48 hours.
Figure 5
Figure 5. ABCG1-deficient BMMs have reduced cholesterol efflux ex vivo and RCT in vivo.
(A) Cholesterol efflux assay was determined as described in Figure 1 with BMMs from WT (ABCG1+/+) or ABCG1-KO (ABCG1–/–) mice. Cholesterol efflux was determined in the presence of HDL3 (25 μg/ml) or lipid-free apoA-I (10 μg/ml) for 2 hours. Data are expressed as mean ± SD; n = 3. *P < 0.05. (B) Cholesterol efflux was determined as described above, except cells were incubated for 2 hours either in the presence or absence probucol (20 μM) prior to the addition of 2.5% mouse whole serum as the acceptor. Data are expressed as mean ± SD; n = 3. **P < 0.01; ***P < 0.001. (C and D) The RCT assay was performed as described in Figure 1 with [3H]cholesterol-labeled, acLDL-loaded, and LXR agonist–treated BMMs from ABCG1+/+ or ABCG1–/– mice. n = 8 mice per group. Data are expressed as the percentage of tracer relative to total cpm tracer injected ± SEM. **P < 0.01; ***P < 0.001. Results are representative of 2 independent experiments. (C) Time course of [3H]cholesterol distribution in plasma. Individual time points and areas under the curve were determined and compared. (D) Fecal [3H]tracer levels. Feces were collected continuously from 0 to 48 hours.
Figure 6
Figure 6. Double knockdown of ABCA1 and ABCG1 in J774 macrophages impairs cholesterol efflux in vitro and RCT in vivo.
(A) Quantitative analysis of mRNA expression of abca1 and abcg1 in control, ABCG1-KD, and ABCA1/ABCG1-DKD cells by quantitative RT-PCR. Data are expressed as fold change ± SD and normalized to mouse 18S rRNA. (B) Cholesterol efflux assay was performed as described in Figure 1 using lipid-free apoA-I (10 μg/ml) as the acceptor. (C) Cholesterol efflux was determined as described above, except cells were incubated for 2 hours either in the presence of absence of probucol (20 μM) prior to the addition of 2.5% mouse whole serum as the acceptor. Data are expressed as mean ± SD; n = 3. **P < 0.01; ***P < 0.001. (D and E) The RCT assay was performed as described in Figure 1 with [3H]cholesterol-labeled, acLDL-loaded, and LXR agonist–treated control, ABCG1-KD, and DKD cells. n = 6 mice per group. Data are expressed as the percentage of tracer relative to total cpm tracer injected ± SEM. *P < 0.05; **P < 0.01; ***P < 0.001. (D) Time course of [3H]cholesterol distribution in plasma. Areas under the curve were determined and compared. (E) Fecal [3H]tracer levels. Feces were collected continuously from 0 to 48 hours.

References

    1. Cuchel M., Rader D.J. Macrophage reverse cholesterol transport: key to the regression of atherosclerosis? Circulation. 2006;113:2548–2555. - PubMed
    1. Linsel-Nitschke P., Tall A.R. HDL as a target in the treatment of atherosclerotic cardiovascular disease. Nat. Rev. Drug Discov. 2005;4:193–205. - PubMed
    1. Wang N., Silver D.L., Costet P., Tall A.R. Specific binding of ApoA-I, enhanced cholesterol efflux, and altered plasma membrane morphology in cells expressing ABC1. J. Biol. Chem. 2000;275:33053–33058. - PubMed
    1. Oram J.F., Lawn R.M., Garvin M.R., Wade D.P. ABCA1 is the cAMP-inducible apolipoprotein receptor that mediates cholesterol secretion from macrophages. J. Biol. Chem. 2000;275:34508–34511. - PubMed
    1. Bortnick A.E., et al. The correlation of ATP-binding cassette 1 mRNA levels with cholesterol efflux from various cell lines. J. Biol. Chem. 2000;275:28634–28640. - PubMed

Publication types

MeSH terms

Substances