

Review
doi: 10.1016/j.cll.2007.05.002.
Optimizing a multicolor immunophenotyping assay
Affiliations
- PMID: 17658403
- PMCID: PMC2034273
- DOI: 10.1016/j.cll.2007.05.002
Item in Clipboard
Review
Optimizing a multicolor immunophenotyping assay
Clin Lab Med.
2007 Sep.
Abstract
Flow cytometry-based immunophenotyping assays have become increasingly multiparametric, concomitantly analyzing multiple cellular parameters. To maximize the quality of the information obtained, antibody conjugate panels need to be developed with care, including requisite controls at every step. Such an optimization procedure for multicolor immunophenotyping assays is time consuming, but the value of having a reliable antibody conjugate panel that provides for sensitive detection of all molecules of interest justifies this time investment. This article outlines important considerations and procedures to undertake for the successful design and development of multicolor flow cytometry panels.
Figures
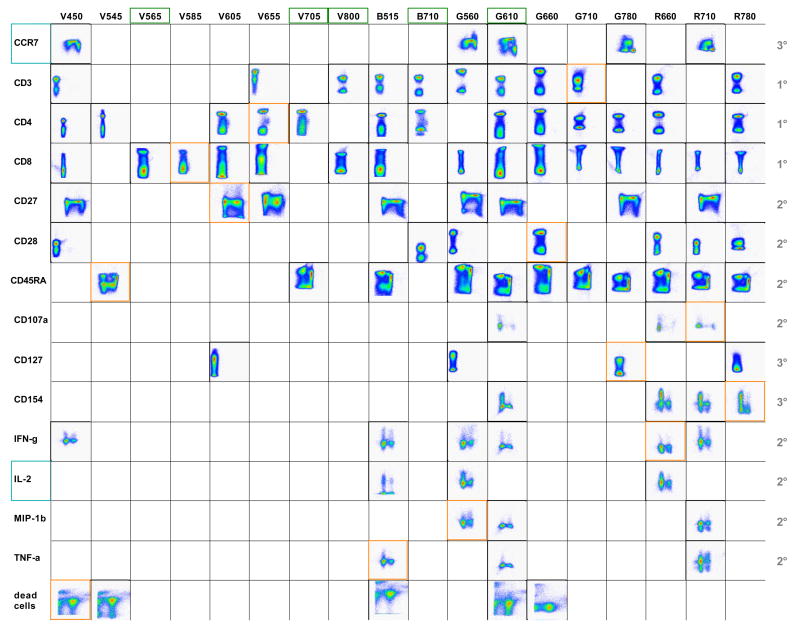
The indicated antigens are read on the y-axis. For CCR7 and CD27, CD45RA expression was co-analyzed (x-axis), while for CD45RA, CCR7 was co-analyzed. For CD107a, CD4 expression is shown on the x-axis, while for CD154, IFN-γ, IL-2, MIP-1β and TNF-α, CD8 is illustrated on the x-axis. Orange frames highlight those antibodies included in the antibody panel to be tested, while green frames mark the detectors that are not used in the panel and could potentially be exploited to include further markers in the assay. Blue frames indicate those antigens not included in the selected antibody panel. Numbers on the right hand side of the table indicate primary (1°), secondary (2°) and tertiary (3°) antigens.
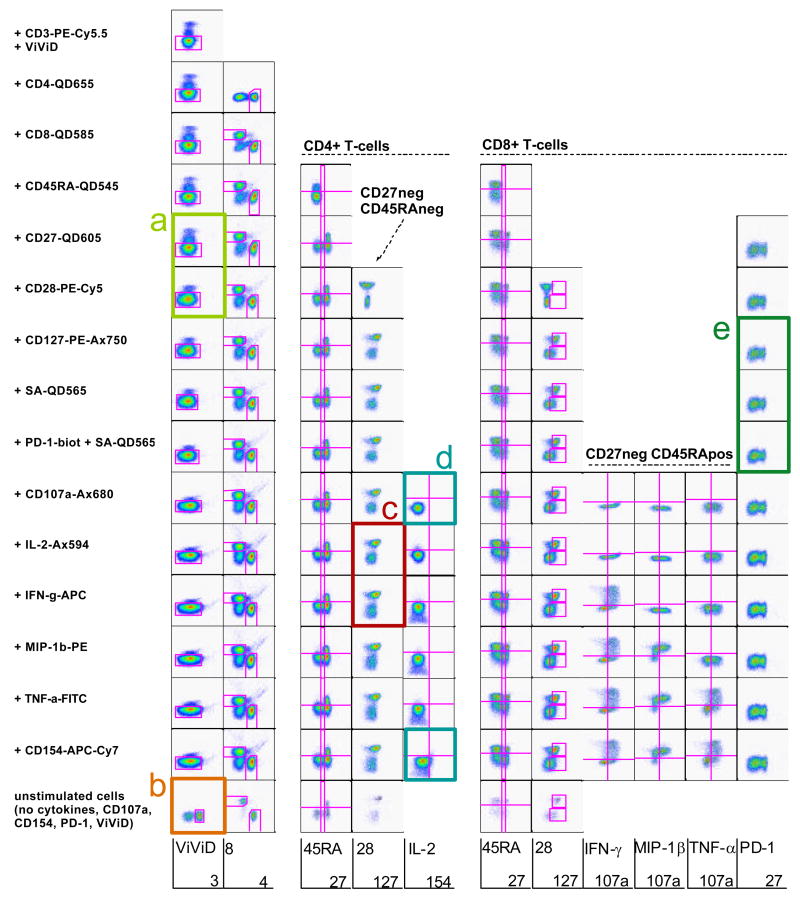
In order to determine whether antibody conjugates selected for a multi-colour panel produce signal interference, a series of samples were labelled with subsets of the antibodies making up the panel. The first sample contained one antibody conjugate only (plus ViViD to exclude dead cells), while each subsequent sample contained one more antibody conjugate. Each row depicts plots from a single sample, and the antibody conjugate added at each point is indicated at the left of each respective row. For each sample, dot plots were created that follow the gating strategy to be used during analysis as far as it can be predicted. This allows the identification of antibody conjugates that create signal interferences with other antibody conjugates or simply do not result in sufficient detection sensitivity in the present antibody combination.

The coloured boxes from the panel evaluation illustrated in Fig. 2 are enlarged here in order to better visualize the problems identified.
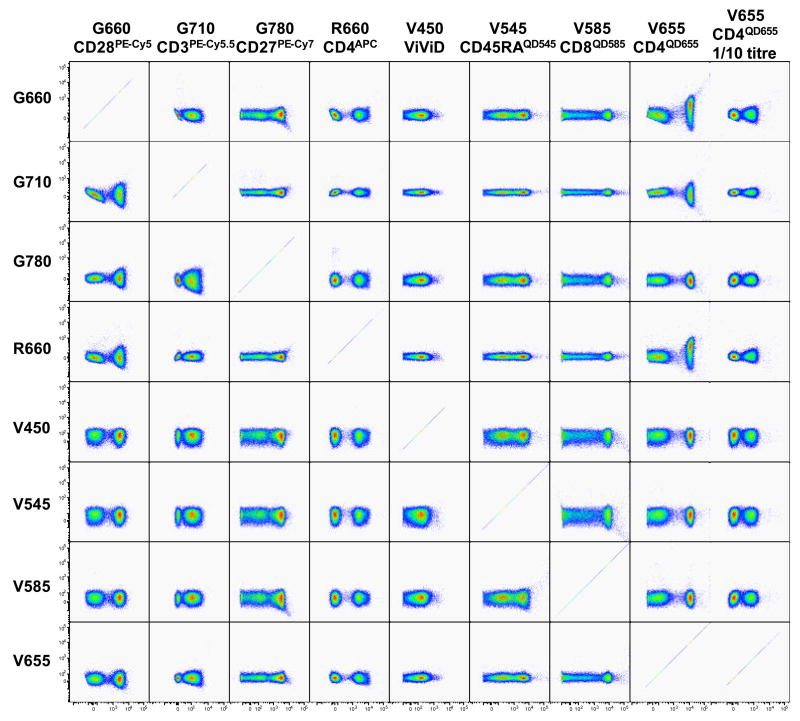
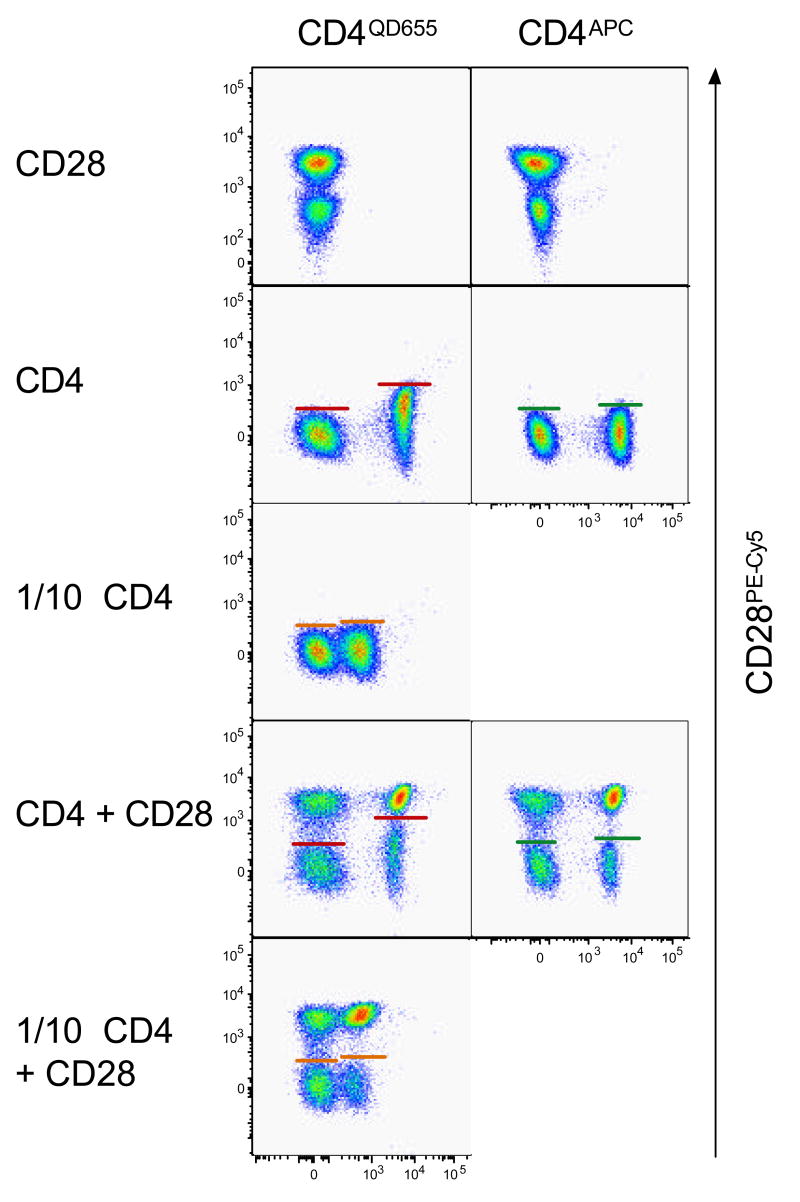
A. A spreading error analysis is performed on samples labelled with single antibody conjugates. For every sample, the detector relevant for the antibody conjugate (x-axis) added is plotted against all other detectors to be used in the experiment (y-axis). This allows to rapidly detect spreading errors that would reduce sensitivity in other detectors, such as obtained with CD4QD655. Diluting the reagent by 1/10 obliterates this problem. B. Spreading error of QD655pos cells reduces the sensitivity of the G660 detector for PE-Cy5pos signals on QD655pos cells (red lines). The severe spreading error observed with previously titrated amounts of anti-CD4QD655 (V655) in the G660 detector can be corrected by either using a lower titre of the anti-CD4QD655 antibody or by replacing it with another anti-CD4 conjugate, such as an anti-CD4APC antibody (R660).
A. A spreading error analysis is performed on samples labelled with single antibody conjugates. For every sample, the detector relevant for the antibody conjugate (x-axis) added is plotted against all other detectors to be used in the experiment (y-axis). This allows to rapidly detect spreading errors that would reduce sensitivity in other detectors, such as obtained with CD4QD655. Diluting the reagent by 1/10 obliterates this problem. B. Spreading error of QD655pos cells reduces the sensitivity of the G660 detector for PE-Cy5pos signals on QD655pos cells (red lines). The severe spreading error observed with previously titrated amounts of anti-CD4QD655 (V655) in the G660 detector can be corrected by either using a lower titre of the anti-CD4QD655 antibody or by replacing it with another anti-CD4 conjugate, such as an anti-CD4APC antibody (R660).
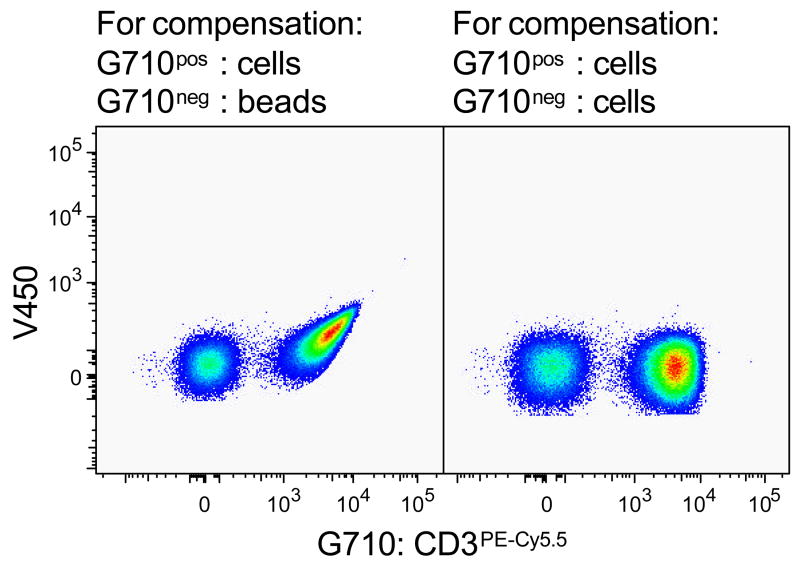
Both pseudo-colour plots depict the same PBMC sample labelled with anti-CD3PE-Cy5.5 antibody. PE-Cy5.5 fluorescence was compensated using this very sample. However, for the left dot plot unlabeled CompBeads were used as the PE-Cy5.5neg control, while unlabeled PBMC were used for the right dot plot.
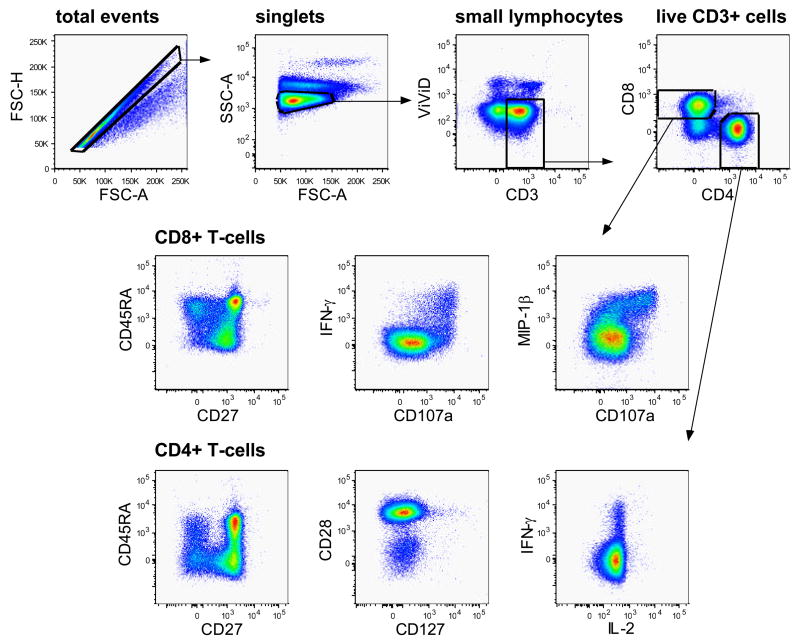
The sequential gating strategy applied for the analysis of CD4+ and CD8+ T-cell responses is illustrated by the gates and arrows. Healthy donor PBMC were incubated with anti-CD3 and anti-CD28 antibodies in the presence of CD107aAx680 and monensin. Note that CD3 molecules were visualized by intracellular labelling. After gating on single-cells, analysis was narrowed down on small lymphocytes. Live CD3+ T-cells were identified and further subdivided into CD4+ and CD8+ T-cells. These were subsequently analyzed for activation markers and cytokines of interest. Some pseudo-colour plots for possible antigen combinations are illustrated.
References
-
- Heeney JL, Plotkin SA. Immunological correlates of protection from HIV infection and disease. Nat Immunol. 2006 Dec;7(12):1281–1284. - PubMed
-
- Roederer M, Brenchley JM, Betts MR, De Rosa SC. Flow cytometric analysis of vaccine responses: how many colors are enough? Clin Immunol. 2004 Mar;110(3):199–205. - PubMed
-
- Perfetto SP, Roederer M. Increased immunofluorescence sensitivity using 532 nm laser excitation. Cytometry A. 2007 Jan 2; - PubMed
-
- Perfetto SP, Chattopadhyay PK, Roederer M. Seventeen-colour flow cytometry: unravelling the immune system. Nat Rev Immunol. 2004 Aug;4(8):648–655. - PubMed
-
- Perfetto SP, Chattopadhyay PK, Lamoreaux L, et al. Amine reactive dyes: an effective tool to discriminate live and dead cells in polychromatic flow cytometry. J Immunol Methods. 2006 Jun 30;313(1–2):199–208. - PubMed
Publication types
MeSH terms
Substances
Grants and funding
LinkOut - more resources
Full Text Sources
Other Literature Sources
