

doi: 10.1016/j.cll.2007.05.008.
Cellular image analysis and imaging by flow cytometry
Affiliations
- PMID: 17658411
- PMCID: PMC2034394
- DOI: 10.1016/j.cll.2007.05.008
Item in Clipboard
Cellular image analysis and imaging by flow cytometry
Clin Lab Med.
2007 Sep.
Abstract
Imaging flow cytometry combines the statistical power and fluorescence sensitivity of standard flow cytometry with the spatial resolution and quantitative morphology of digital microscopy. The technique is a good fit for clinical applications by providing a convenient means for imaging and analyzing cells directly in bodily fluids. Examples are provided of the discrimination of cancerous from normal mammary epithelial cells and the high-throughput quantitation of fluorescence in situ hybridization (FISH) probes in human peripheral blood mononuclear cells. The FISH application will be enhanced further by the integration of extended depth-of-field imaging technology with the current optical system.
Figures
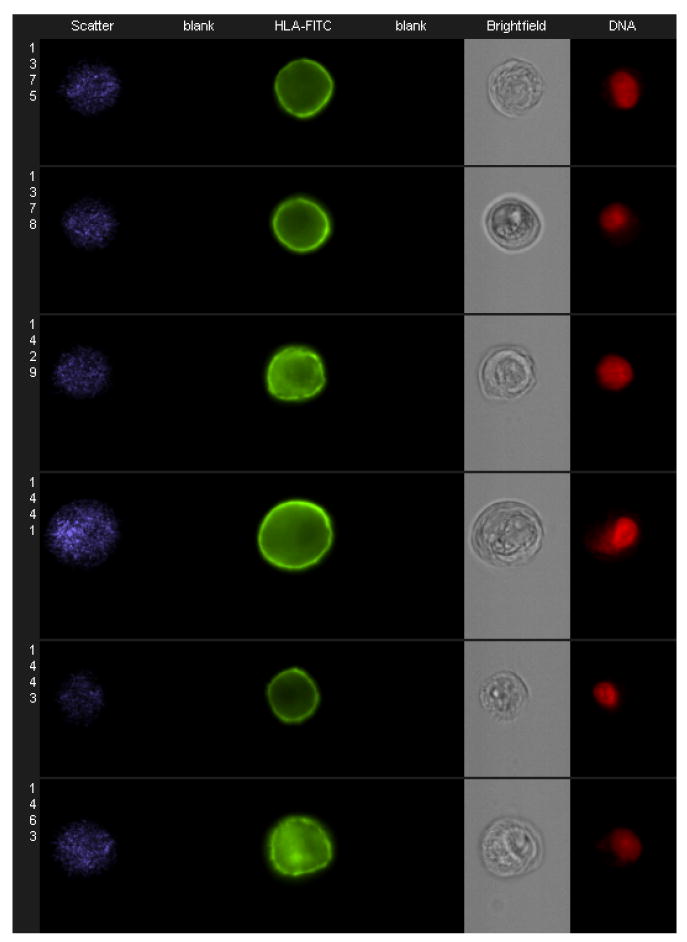
Normal Mammary Epithelial Cells. Each cell is represented by a row of four images acquired simultaneously in flow, from left to right: darkfield (blue), FITC fluorescence from an HLA marker applied only to normal cells (green), brightfield (gray), and fluorescence from the DNA binding dye DRAQ5 (red).
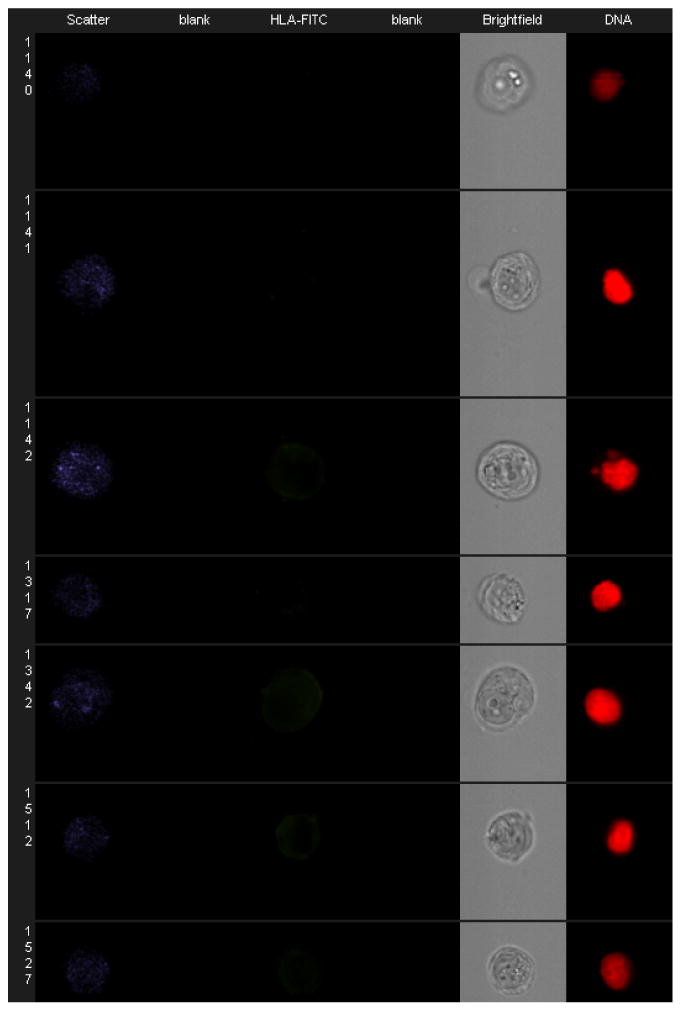
Mammary Carcinoma Cells. Each cell is represented by a row of four images acquired simultaneously in flow, from left to right: darkfield (blue), FITC fluorescence (green), brightfield (gray), and fluorescence from the DNA binding dye DRAQ5 (red).
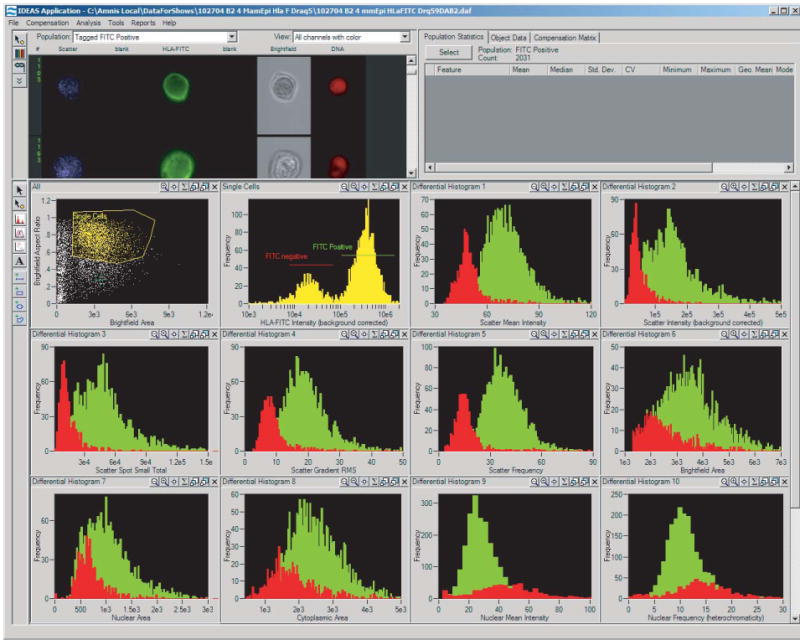
Screen Capture of the IDEAS Statistical Image Analysis Package. Each of the 10 differential histograms represent a different quantitative parameter that discriminates between normal mammary cells (green distributions) and mammary carcinoma cells (red distributions) mixed in the same sample.
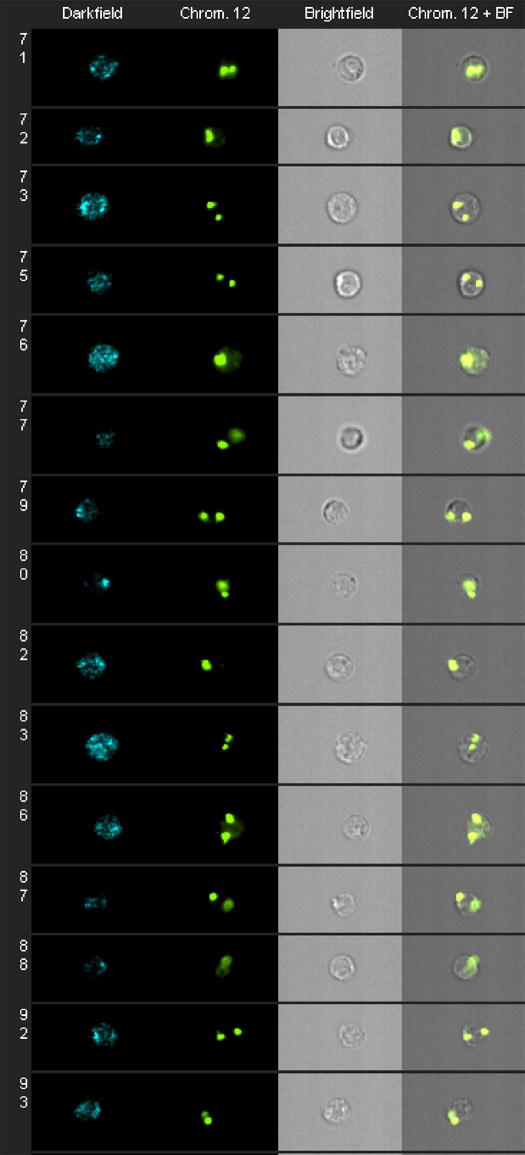
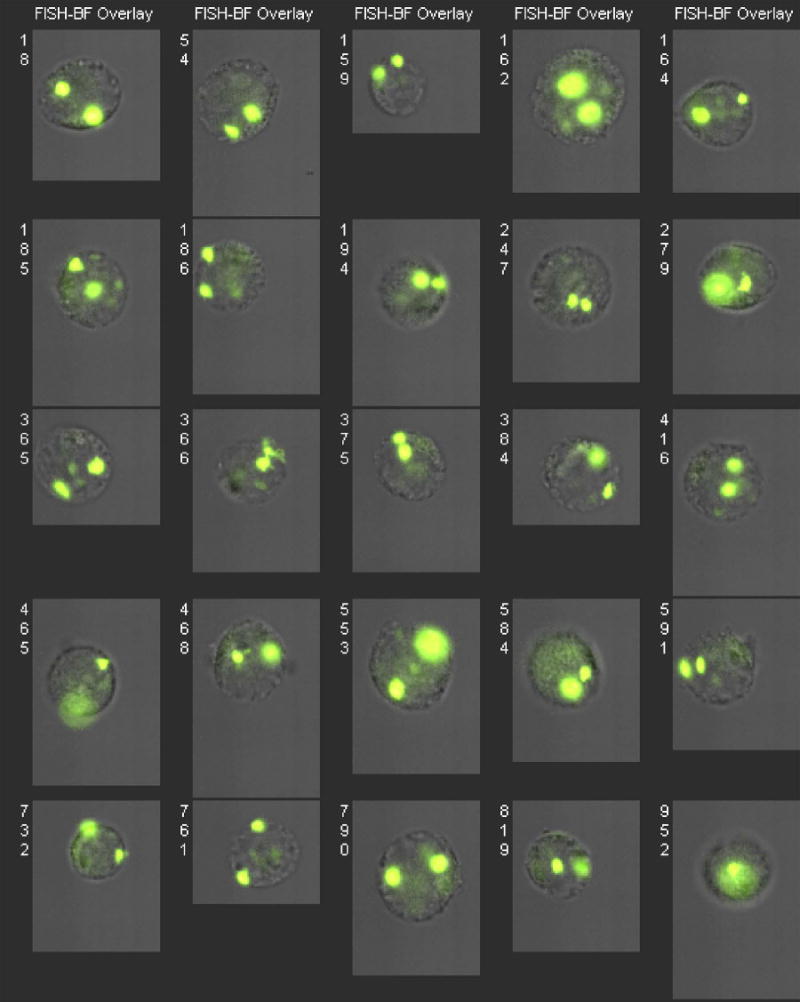
Human Peripheral Blood Mononuclear Cells Hybridized in Suspension with a Chromosome 12 Probe. Each cell is represented by a row of four images, from left to right: darkfield (blue), fluorescence from a chromosome 12-SpectrumGreen probe (green), brightfield (gray), and a superposition of the fluorescence and brightfield images. An unbiased selection of cells illustrates variation in probe intensity, focus quality, and orientation with respect to the optic axis.
Jurkat Cells Hybridized in Suspension with a Chromosome 8 Probe and Imaged in Flow Using Standard Optics. Each cell is represented by a superposition of its chromosome 8 fluorescence (green) and brightfield (gray) images. Jurkat cells are larger than human PBMC and exacerbate variations in image focus quality.
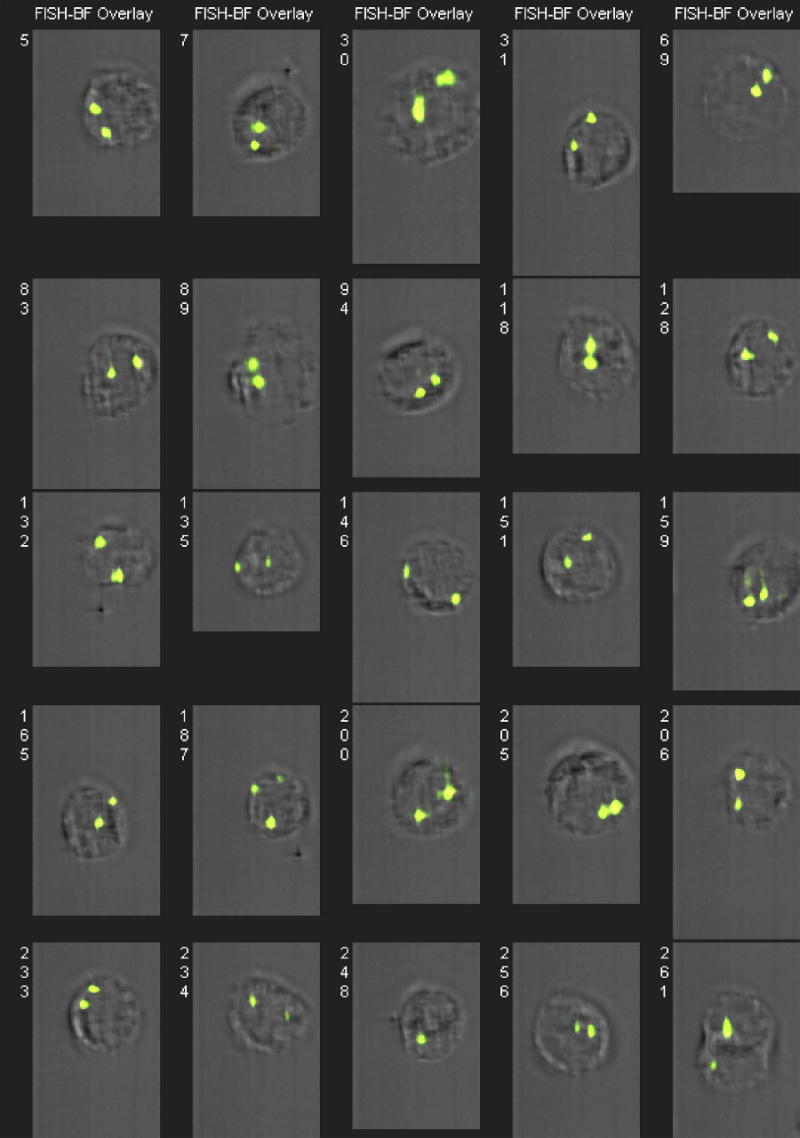
Jurkat Cells Hybridized in Suspension with a Chromosome 8 Probe and Imaged in Flow Using Extended Depth of Field Optics. Each cell is represented by a superposition of its chromosome 8 fluorescence (green) and brightfield (gray) images. Extended depth of field imaging greatly improves focus quality and the accuracy of FISH spot enumeration.
References
-
- Francastel C, Walters MC, Groudine M, Martin DI. A functional enhancer suppresses silencing of a transgene and prevents its localization close to centrometric heterochromatin. Cell. 1999 Oct 29;99(3):259–269. - PubMed
-
- Hulspas R, Bauman JG. The use of fluorescent in situ hybridization for the analysis of nuclear architecture by confocal microscopy. Cell Biol Int Rep. 1992 Aug;16(8):739–747. - PubMed
-
- Orchard JA, Ibbotson RE, Davis Z, et al. ZAP-70 expression and prognosis in chronic lymphocytic leukaemia. Lancet. 2004 Jan 10;363(9403):105–111. - PubMed
-
- Kay DB, Cambier JL, Wheeless LL., Jr Imaging in flow. J Histochem Cytochem. 1979 Jan;27(1):329–334. - PubMed
-
- Cambier JL, Kay DB, Wheeless LL., Jr A multidimensional slit-scan flow system. J Histochem Cytochem. 1979 Jan;27(1):321–324. - PubMed
Publication types
MeSH terms
Grants and funding
LinkOut - more resources
Full Text Sources
Other Literature Sources
Medical
