. 2007 Jul;3(7):e99.
doi: 10.1371/journal.ppat.0030099.

Microfluidic modeling of cell-cell interactions in malaria pathogenesis

Affiliations

Microfluidic modeling of cell-cell interactions in malaria pathogenesis

Meher Antia et al. PLoS Pathog. 2007 Jul.

Abstract

The clinical outcomes of human infections by Plasmodium falciparum remain highly unpredictable. A complete understanding of the complex interactions between host cells and the parasite will require in vitro experimental models that simultaneously capture diverse host-parasite interactions relevant to pathogenesis. Here we show that advanced microfluidic devices concurrently model (a) adhesion of infected red blood cells to host cell ligands, (b) rheological responses to changing dimensions of capillaries with shapes and sizes similar to small blood vessels, and (c) phagocytosis of infected erythrocytes by macrophages. All of this is accomplished under physiologically relevant flow conditions for up to 20 h. Using select examples, we demonstrate how this enabling technology can be applied in novel, integrated ways to dissect interactions between host cell ligands and parasitized erythrocytes in synthetic capillaries. The devices are cheap and portable and require small sample volumes; thus, they have the potential to be widely used in research laboratories and at field sites with access to fresh patient samples.


Conflict of interest statement

Competing interests. The authors have declared that no competing interests exist.

Figures

Figure 1
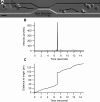
Figure 1. Trajectories of iRBCs Rolling on ICAM-1
(A−C) iRBCs rolling on purified protein. RBC solution at 5% hematocrit and 7% parasitemia was flowed at different pressures through a channel functionalized with ICAM-1, as described in the Methods section. At all measured pressures, 86% of cells that adhered to the surface rolled rather than remained stationary. Of cells that rolled, 99% continued rolling for hundreds of microns rather than arresting on the surface or detaching. (A) Dots mark the spatial position of sample iRBCs every 0.1 s. (B) Instantaneous velocity of iRBCs. (C) Distance to origin over 20 s of rolling. At the high pressures shown here (3 kPa), iRBCs on ICAM-1 rolled in a jerky, stepwise fashion with brief, periodic velocity minima occurring approximately every 0.7 s. See also Video S1. (D−F) iRBCs rolling on mammalian cells expressing ICAM-1 (CHO-ICAM). CHO-ICAM were seeded in channels as described in the Methods section and grown to confluence under continuous flow conditions for 2 d. RBC suspensions at 5% parasitemia and 10% hematocrit were flowed through the channels at various pressures. (D) Dots mark the spatial position of a typical iRBC every 0.1 s. (E) iRBC instantaneous velocity. (F) Distance to origin of a rolling iRBC at an applied pressure of 2 kPa. On CHO-ICAM, iRBCs move sporadically, often coming to a complete halt before starting to roll again, usually deviating significantly from a straight path. Several iRBCs remain statically adhered and do not roll. Scale bars = 10 μm. See also Video S2.
Figure 2
Figure 2. Changes in Rolling Velocities of iRBCs on Purified CD36 and ICAM-1
Box and whisker plots are generated from tracking the average velocities of populations of individual cells rolling either on recombinant CD36 or on recombinant ICAM-1. The top and bottom of the box denote the 75th and 25th percentiles of the population, respectively, and the top and bottom of the whiskers denote the 90th and 10th percentiles, respectively. Outliers are marked with open circles. (A) Stabilization of rolling velocities of iRBCs on CD36. At pressures where rolling is observed on CD36, average rolling velocities of most cells remain stable at between approximately 1 and 3 μm/s. Difference between rolling velocities at all pressures was not statistically significant (ANOVA, p > 0.01). A few outliers are observed with higher rolling velocities (up to 22 μm/s) at 2 kPa. (B) Variation in rolling velocity on ICAM-1 at different pressures. Populations of iRBCs on ICAM-1 at different pressures showed inhomogeneity of variances (Levene's test, F = 12); thus, statistical significance of differences in means could not be evaluated. However, box and whisker plots show only a gradual increase in rolling velocity of most infected cells at higher flow pressures, and only higher velocity rollers increase rolling velocity in direct proportion to increased fluid pressures. At 4 kPa, the highest rolling velocity increased to 45 μm/s, from 32 μm/s at 3 kPa and 26 μm/s at 2 kPa. In contrast, the median rolling velocity only increased to 14.6 μm/s at 4 kPa from 12.1 μm/s at 3 kPa, 10.7 μm/s at 2 kPa, and 9.5 μm/s at 1 kPa.
Figure 3
Figure 3. Rolling iRBCs Merging into a Single Channel from a Bifurcation
The branching channel was functionalized with ICAM-1. (A, C) Dots represent the spatial position of two differently behaving, rolling iRBCs every 0.1 s at 3 kPa applied pressure. (B) Instantaneous velocity of a rolling cell pictured in (A). The iRBC approaches the fork in the channel after approximately 8 s, but shows no change in rolling velocity. (D) Instantaneous velocity of a rolling iRBC pictured in (C). The iRBC is rolling with a higher velocity than the one pictured in (A) and approaches the fork after approximately 3 s. The iRBC continues rolling in the straight portion of the channel, albeit at a much higher velocity. Scale bar = 25 μm. See also Video S3.
Figure 4
Figure 4. Preferential Attachment of iRBCs in Regions of Lower Fluid Shear Stress
In a network of capillaries coated with CD36, a larger number of iRBCs attach in the branches, where shear stress is lower than in the main channel. Applied pressure is 1 kPa across the entire network, making the pressure in individual branches low enough for iRBCs to bind to CD36 in a stationary manner rather than rolling. Image was taken after approximately 10 min of continuous flow. Scale bar = 50 μm.
Figure 5
Figure 5. Passage of iRBCs through a Constricted Channel Functionalized with ICAM-1
(A) Tracking the movement of an iRBC in a narrowing constriction. Dots mark the spatial position of a typical iRBC every 0.1 s before and after passage through the constriction. (B) Instantaneous velocity of iRBC. Before reaching the constriction, the iRBC moved with the typical jerky, stepwise motion of rolling iRBCs. The velocity spiked each time an iRBC passed through the constriction. (C) Distance from origin of an iRBC over time. The iRBC moved uniform distances over each time step before reaching the constriction. The erythrocyte then moved through the entire distance of the constriction within a single time frame of 0.1 s. Scale bar = 10 μm. See also Video S4.
Figure 6
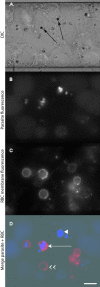
Figure 6. Phagocytosis of iRBCs under Flow
(A) Differential interference contrast image of RAW macrophages in a 50-μm channel after lysis of attached RBCs. Arrows show the malarial pigment, hemozoin. (B) Fluorescence image of parasite nuclei ingested by macrophages. (C) DiIC staining of RBC membranes. (D) Parasite DNA fluorescence (blue) and RBC membranes (red) merged. Long arrow shows ingestion of entire iRBC, arrowhead shows ingestion of only the parasite, and double arrowhead shows ingestion of RBC without parasite. Scale bar = 10 μm.

References

    1. Miller LH, Baruch DI, Marsh K, Doumbo OK. The pathogenic basis of malaria. Nature. 2002;415:673–679. - PubMed
    1. Brown H, Hien TT, Day N, Mai NT, Chuong LV, et al. Evidence of blood–brain barrier dysfunction in human cerebral malaria. Neuropathol Appl Neurobiol. 1999;25:331–340. - PubMed
    1. Dondorp AM, Pongponratn E, White NJ. Reduced microcirculatory flow in severe falciparum malaria: Pathophysiology and electron-microscopic pathology. Acta Trop. 2004;89:309–317. - PubMed
    1. Turner GD, Ly VC, Nguyen TH, Tran TH, Nguyen HP, et al. Systemic endothelial activation occurs in both mild and severe malaria. Correlating dermal microvascular endothelial cell phenotype and soluble cell adhesion molecules with disease severity. Am J Pathol. 1998;152:1477–1487. - PMC - PubMed
    1. Cranston HA, Boylan CW, Carroll GL, Sutera SP, Williamson JR, et al. Plasmodium falciparum maturation abolishes physiologic red cell deformability. Science. 1984;223:400–403. - PubMed

Publication types

MeSH terms

Substances