

Establishing models of portal vein occlusion and evaluating value of multi-slice CT in hepatic VX2 tumor in rabbits
- PMID: 17659672
- PMCID: PMC4172713
- DOI: 10.3748/wjg.v13.i24.3333
Establishing models of portal vein occlusion and evaluating value of multi-slice CT in hepatic VX2 tumor in rabbits
Abstract
Aim: To establish models of portal vein occlusion of hepatic VX2 tumor in rabbits and to evaluate the value of multi-slice CT.
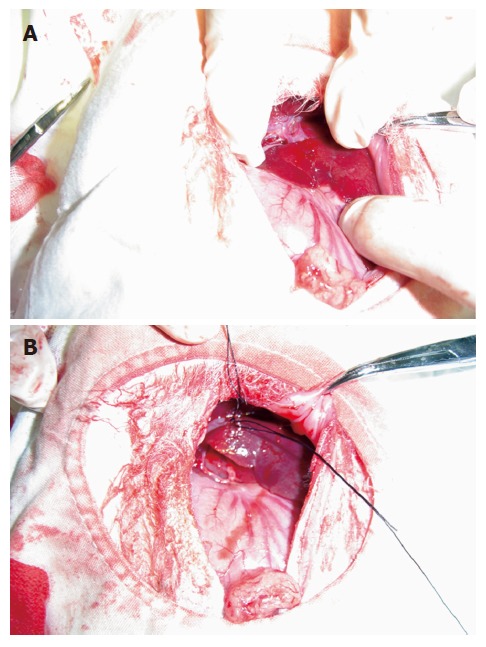
Methods: Forty New Zealand rabbits were divided into 4 groups according to digital table: Immediate group (group A; transplantation of tumor immediately after the portal vein occlusion), 3-wk group (group B; transplantation of tumor at 3 wk after the portal vein occlusion), negative control group (group C) and positive control group (group D), 10 rabbits in each group. Hepatic VX2 tumor was transplanted with abdominal-embedding inoculation immediately after the portal vein occlusion and at 3 wk after the portal vein occlusion. Meanwhile, they were divided into negative control group (Left external branch of portal vein was occluded by sham-operation, and left exite was embedded and inoculated pseudoly) and positive control group (Transplanted tumor did not suffer from the portal vein occlusion). All rabbits were scanned with multi-slice CT.
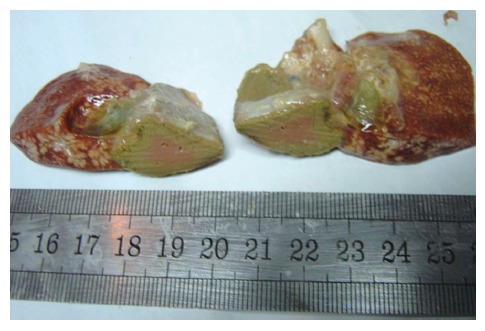
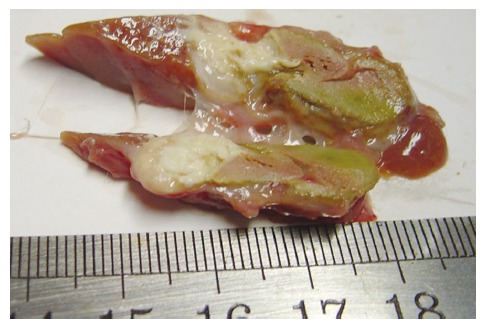
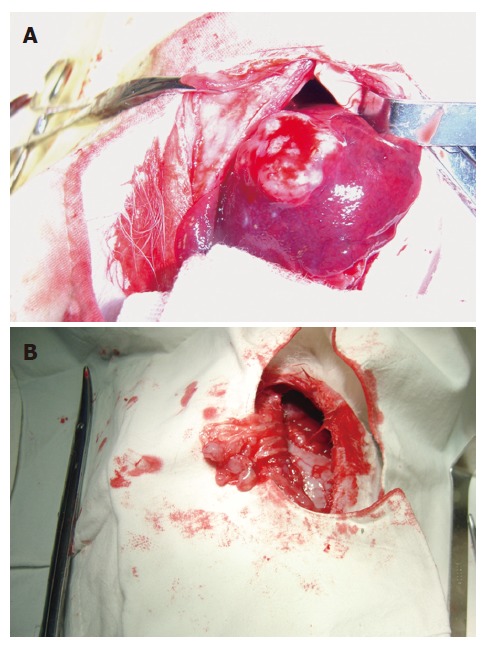
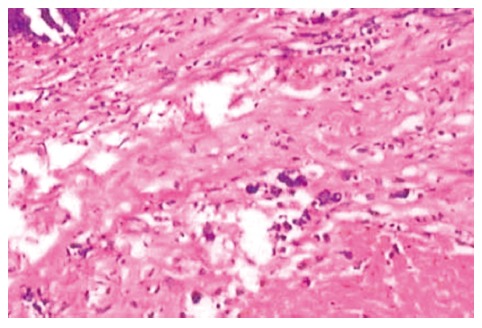
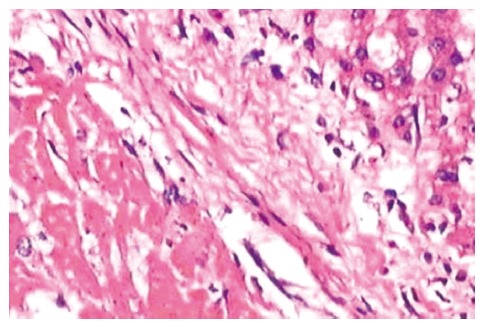
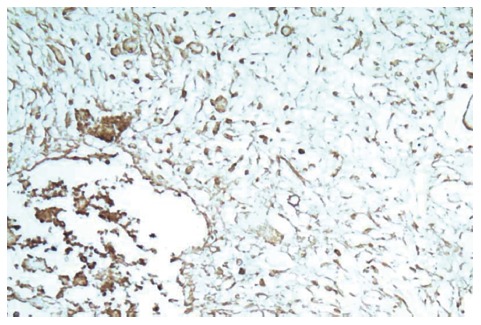
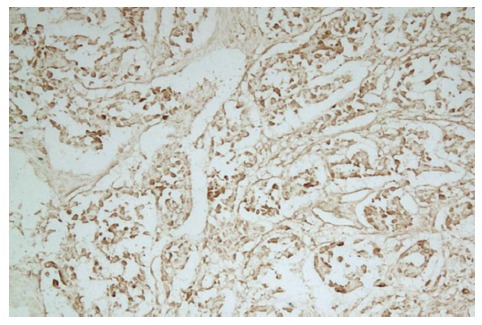
Results: All 40 animals were employed in the final analysis without death. Tumor did not grow in both immediate group and 3-wk group. In 3-wk group, left endite was atrophied and growth of tumor was inhibited. The maximal diameter of tumor was significantly smaller than that in positive control group (2.55 +/- 0.46 vs 3.59 +/- 0.37 cm, t = 5.57, P < 0.001). Incidences of metastasis in the liver and lung were lower in 3-wk group than those in positive control group (10% vs 40%, and 90% vs 100%, respectively). The expression intensities of the vascular endothelium growth factor (VEGF) in groups A, B, C and D were 0.10 +/- 0.06, 0.66 +/- 0.21, 0.28 +/- 0.09 and 1.48 +/- 0.32, respectively. VEGF expression level in the test group A was significantly lower than that in the negative control group C (t = 5.07; P < 0.001). In addition, VEGF expression in the test group B was significantly lower than that in the positive control group D (t = 6.38; P < 0.001). Scanning with multi-slice CT showed that displaying rate of hepatic artery branches was obviously lower in grade III (40%) than that in grade I (70%) and II (100%) (P < 0.05); but there was no significant difference in displaying rate of the portal vein at various grades. Values of blood flow (BF) of the liver, blood volume (BV), mean transit time (MTT) and permeability of vascular surface (PS) were lower in the immediate group and 3-wk group than those in control groups, but values of hepatic arterial fraction (HAF) were increased. Significant positive correlations were existed between BF and BV (r = 0.905, P < 0.01), and between BF and PS (r = 0.967, P < 0.01), between BV and PS (r = 0.889, P < 0.01). A significant negative correlation existed between PV and HAF (r = -0.768, P < 0.01), between PS and HAF (r = -0.557, P < 0.01). The values of BF, BV and PS had a positive correlation with VEGF (r(BF) = 0.842, r(BV) = 0.579, r(PS) = 0.811, P < 0.01) . However, there was no significant correlation between the values of MTT and HAF and the VEGF expression (r(MTT) = 0.066, r(HAF) = -0.027).
Conclusion: Ligating the left external branch of portal vein is an ideal way to establish models of portal vein occlusion in rabbits with hepatic VX2 tumor. Multi-slice CT plays a key role in evaluating effect of portal vein occlusion.
Figures
Similar articles
-
The role of perfusion CT as a follow-up modality after transcatheter arterial chemoembolization: an experimental study in a rabbit model.Invest Radiol. 2010 Jul;45(7):427-36. doi: 10.1097/RLI.0b013e3181e07516. Invest Radiol. 2010. PMID: 20440211
-
[Evaluation of total liver perfusion imaging of CT for efficacy of transcatheter arterial chemoembolization combined with apatinib on rabbit VX2 liver tumors].Zhong Nan Da Xue Xue Bao Yi Xue Ban. 2019 May 28;44(5):477-484. doi: 10.11817/j.issn.1672-7347.2019.05.002. Zhong Nan Da Xue Xue Bao Yi Xue Ban. 2019. PMID: 31303609 Chinese.
-
[Blood supply of liver metastatic tumors observed by both CT arterial portography via superior mesenterica arterial and multi-slice spiral CT perfusion imaging].Ai Zheng. 2007 Nov;26(11):1257-62. Ai Zheng. 2007. PMID: 17991329 Chinese.
-
Hepatic portal vein branching patterns according to different liver assessment methods and classifications of branching type.Ann Anat. 2024 Feb;252:152204. doi: 10.1016/j.aanat.2023.152204. Epub 2023 Dec 23. Ann Anat. 2024. PMID: 38142799 Review.
-
A systematic review and meta-analysis of portal vein morphometry in pediatric and adult populations: Drawing the line between normal and abnormal findings.Eur J Radiol. 2023 Nov;168:111016. doi: 10.1016/j.ejrad.2023.111016. Epub 2023 Jul 27. Eur J Radiol. 2023. PMID: 37742371
Cited by
-
Evaluation of the rabbit liver by direct portography and contrast-enhanced computed tomography: anatomical variations of the portal system and hepatic volume quantification.Eur Radiol Exp. 2017;1(1):7. doi: 10.1186/s41747-017-0011-8. Epub 2017 Jun 29. Eur Radiol Exp. 2017. PMID: 29708175 Free PMC article.
References
-
- Uenishi T, Kubo S, Hirohashi K, Tanaka H, Shuto T, Yamamoto T, Tanaka S, Ogawa M, Kinoshita H. A long-term survival case underwent repeated hepatic arterial infusion chemotherapy with portal branch ligation and wrapping of the liver using sheets for hepatocellular carcinoma. Hepatogastroenterology. 2002;49:1423–1424. - PubMed
-
- Nanashima A, Yamaguchi H, Shibasaki S, Morino S, Ide N, Takeshita H, Tsuji T, Sawai T, Nakagoe T, Nagayasu T, et al. Relationship between CT volumetry and functional liver volume using technetium-99m galactosyl serum albumin scintigraphy in patients undergoing preoperative portal vein embolization before major hepatectomy: a preliminary study. Dig Dis Sci. 2006;51:1190–1195. - PubMed
-
- Gaub J, Iversen J. Rat liver regeneration after 90% partial hepatectomy. Hepatology. 1984;4:902–904. - PubMed
-
- Tanikake M, Shimizu T, Narabayashi I, Matsuki M, Masuda K, Yamamoto K, Uesugi Y, Yoshikawa S. Three-dimensional CT angiography of the hepatic artery: use of multi-detector row helical CT and a contrast agent. Radiology. 2003;227:883–889. - PubMed
-
- Takahashi S, Murakami T, Takamura M, Kim T, Hori M, Narumi Y, Nakamura H, Kudo M. Multi-detector row helical CT angiography of hepatic vessels: depiction with dual-arterial phase acquisition during single breath hold. Radiology. 2002;222:81–88. - PubMed
MeSH terms
LinkOut - more resources
Full Text Sources
Medical
Miscellaneous
