. 2007 Sep;18(9):1646-52.
doi: 10.1016/j.jasms.2007.06.010. Epub 2007 Jun 30.

Sublimation as a method of matrix application for mass spectrometric imaging

Affiliations

Sublimation as a method of matrix application for mass spectrometric imaging

Joseph A Hankin et al. J Am Soc Mass Spectrom. 2007 Sep.

Abstract

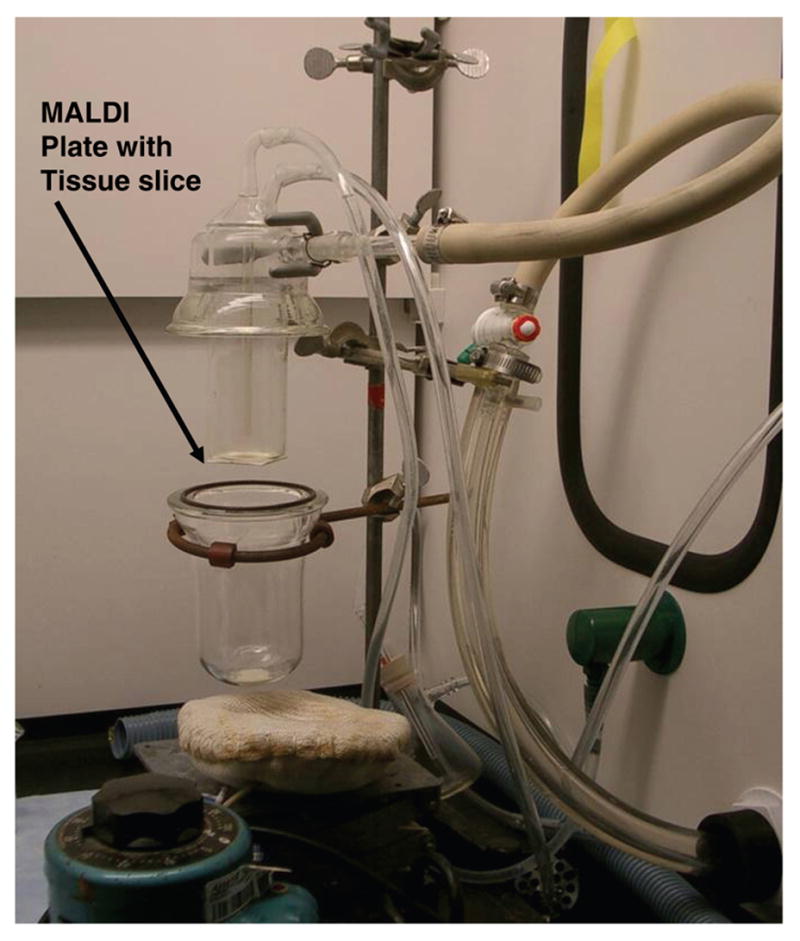
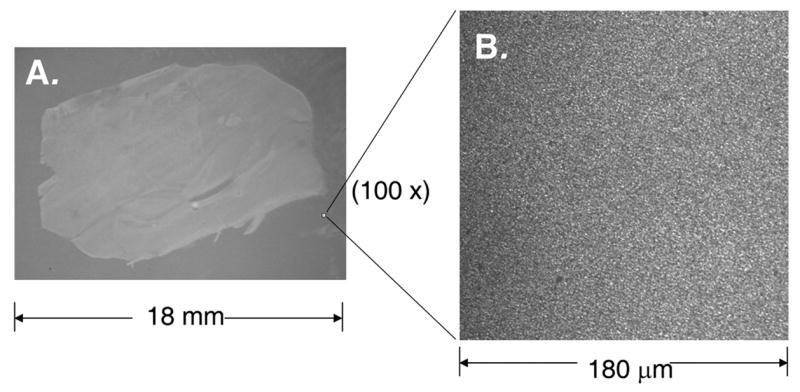
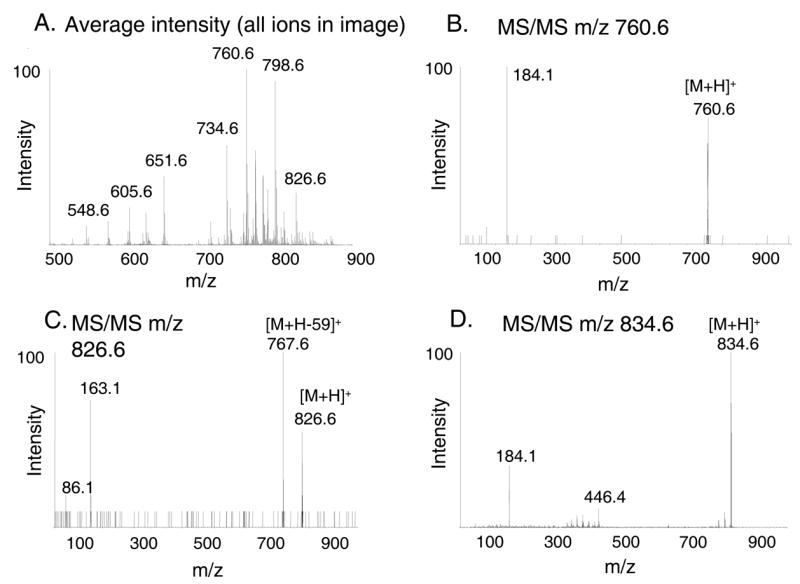
Common organic matrix-assisted laser desorption/ionization (MALDI) matrices, 2,5-dihydroxybenzoic acid, 3,5-dimethoxy-4-hydroxycinnamic acid, and alpha-cyano-4-hydroxycinnamic acid, were found to undergo sublimation without decomposition under conditions of reduced pressure and elevated temperature. This solid to vapor-phase transition was exploited to apply MALDI matrix onto tissue samples over a broad surface in a solvent-free application for mass spectrometric imaging. Sublimation of matrix produced an even layer of small crystals across the sample plate. The deposition was readily controlled with time, temperature, and pressure settings and was highly reproducible from one sample to the next. Mass spectrometric images acquired from phospholipid standards robotically spotted onto a MALDI plate yielded a more intense, even signal with fewer sodium adducts when matrix was applied by sublimation relative to samples where matrix was deposited by an electrospray technique. MALDI matrix could be readily applied to tissue sections on glass slides and stainless steel MALDI plate inserts as long as good thermal contact was made with the condenser of the sublimation device. Sections of mouse brain were coated with matrix applied by sublimation and were imaged using a Q-q-TOF mass spectrometer to yield mass spectral images of very high quality. Image quality is likely enhanced by several features of this technique including the microcrystalline morphology of the deposited matrix, increased purity of deposited matrix, and evenness of deposition. This inexpensive method was reproducible and eliminated the potential for spreading of analytes arising from solvent deposition during matrix application.


Figures

Figure 1
Figure 1
Photograph of sublimation device used to apply matrix to tissue samples for MALDI-MSI experiments. The tissue slice on the MALDI plate insert is attached to the underside of the condenser by thermal conducting tape.
Figure 2
Figure 2
(A) Photograph (3x magnification) of a sagittal section (10 μm thickness) of a mouse brain placed on a stainless steel MALDI plate insert and coated with DHB matrix (4–5 μm thickness) by sublimation. (B) Confocal microscopic image of DHB crystals deposited onto a glass coverslip by sublimation.
Figure 3
Figure 3
(A) Mass spectrometric image (MSI) of 1-palmitoyl-2-stearoyl-sn-glycero-3-phosphocholine standard (16:0, 18:0 GPCho) [M+H]+ m/z 762.6, spotted by robotic microspotter (100 pmol/ spot); DHB matrix was applied by sublimation. The image was acquired with 50 μm pixel size, smoothed and is displayed relative to the intensity scale shown to the left of the image. (B) Mass spectrum averaged over 100 pixels from the MSI of 1-palmitoyl-2-stearoyl-sn-glycero-3-phosphocholine standard (16:0, 18:0 GPCho) [M+H]+ m/z 762.6, [M+Na]+ m/z 784.6; DHB matrix was applied by sublimation. (C) MSI of 1-palmitoyl-2-stearoyl-sn-glycero-3-phosphocholine standard (16:0, 18:0 GPCho) [M+H]+ m/z 762.6, spotted by robotic microspotter (100 pmol/ 2 mm diameter spot); DHB matrix was applied by electrospray (30 mg/mL in 1:1 H2O:CH3CN). The image was acquired with 50 μm plate movements, smoothed, and is displayed relative to the intensity scale shown to the left of the image. (D) Mass spectrum averaged over 100 pixels from the MSI of 1-palmitoyl-2-stearoyl-sn-glycero-3-phosphocholine standard (16:0, 18:0 GPCho) [M+H]+ m/z 762.6, [M+Na]+ m/z 784.6; DHB matrix was applied by electrospray (30 mg/mL in 1:1 H2O:CH3CN)
Figure 4
Figure 4
(A) The averaged full scan mass spectrum for the entire region of the brain tissue slice generated by MALDI. Matrix (DHB) was applied by sublimation, and the tissue was imaged as described in the text. (B) Product ions acquired in the cerebellar region of a sagittal section of mouse brain following collisional activation of the ion at m/z 760.6. Fragmentation to m/z 184 supports the identification of this molecule (imaged in Figure 5B) as a phosphocholine. The molecular mass was consistent with 1-palmitoyl-2-oleoyl-sn-glycero-3-phosphocholine (16:0, 18:1 GPCho, [M+H]+ m/z 760.6) (C) Product ions acquired in the corpus callosum region of the mouse brain section following collisional activation of the ion at m/z 826.6. The fragmentation pattern was consistent with identification as kaliated 18:0a/18:1-GPCho (imaged in Figure 5C). (D) Product ions acquired in the cerebellar region of a sagittal section of mouse brain from collisional activation of the ion at m/z 834.6. Fragmentation to m/z 184 supports the identification of this molecule (imaged in Figure 5D) as a phosphocholine. The molecular mass was consistent with 1-steroyl-2-dodecyl-sn-glycero-3-phosphocholine (18:0, 22:6 GPCho, [M+H]+ m/z 834.6)
Figure 5
Figure 5
(A) Mouse brain, sagittal section, stained with Oil Red O. Section was taken 100 μm lateral from the imaged slice. A tear in the tissue occurred in the pons region during the tissue cutting process. (B) Mass spectrometric image of mouse brain sagittal section acquired in positive ion mode, displayed at m/z 760.6. The image shown was acquired with 50 μm plate movements, and is displayed smoothed, relative to the intensity scale shown at the left of the image. The white bar indicates a 1 mm distance. (C) Mass spectrometric image of mouse brain sagittal section acquired in positive ion mode, displayed at m/z 826.6. The image shown was acquired with 50 μm plate movements, and is displayed smoothed with the scale intensity normalized to the most abundant ion at m/z 760.6. (D) Mass spectrometric image of mouse brain sagittal section acquired in positive ion mode, displayed at m/z 834.6. The image shown was acquired with 50 μm plate movements, and is displayed smoothed with the scale intensity normalized to the most abundant ion at m/z 760.6.

References

    1. Schwartz SA, Weil RJ, Johnson MD, Toms SA, Caprioli RM. Protein Profiling in Brain Tumors Using Mass Spectrometry: Feasibility of a New Technique for the Analysis of Protein Expression. Clin Cancer Res. 2004;10:981–987. - PubMed
    1. Khatib-Shahidi S, Andersson M, Herman JL, Gillespie TA, Caprioli RM. Direct Molecular Analysis of Whole-Body Animal Tissue Sections by Imaging MALDI Mass Spectrometry. Anal Chem. 2006;78:6448–6456. - PubMed
    1. Garrett TJ, Prieto-Conaway MC, Kovtoun V, Bui H, Izgarian N, Stafford G, Yost RA. Imaging of Small Molecules in Tissue Sections With a New Intermediate-Pressure MALDI Linear Ion Trap Mass Spectrometer. Intl J Mass Spectrom. 2007;260:166–176.
    1. Aerni HR, Cornett DS, Caprioli RM. Automated Acoustic Matrix Deposition for MALDI Sample Preparation. Anal Chem. 2006;78:827–834. - PubMed
    1. Jurchen JC, Rubakhin SS, Sweedler JV. MALDI-MS Imaging of Features Smaller Than the Size of the Laser Beam. J Am Soc Mass Spectrom. 2005;16:1654–1659. - PubMed

Publication types

MeSH terms