

Atomic resolution modeling of the ferredoxin:[FeFe] hydrogenase complex from Chlamydomonas reinhardtii
- PMID: 17660315
- PMCID: PMC2025642
- DOI: 10.1529/biophysj.107.108589
Atomic resolution modeling of the ferredoxin:[FeFe] hydrogenase complex from Chlamydomonas reinhardtii
Abstract
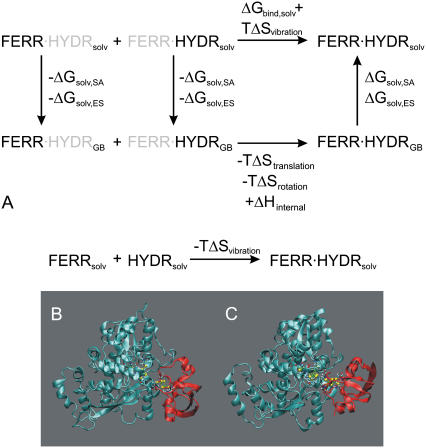
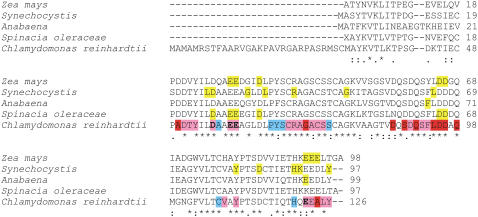
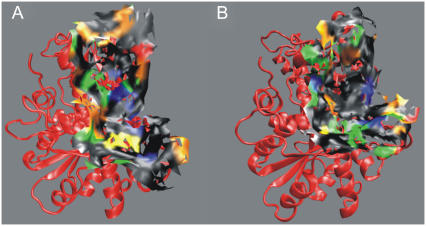
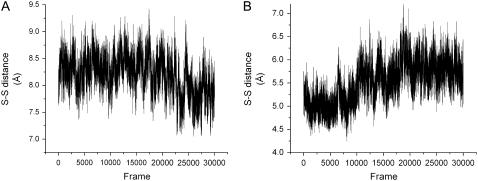
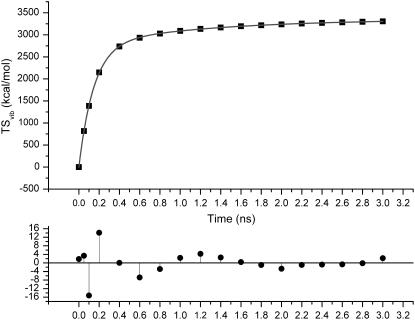
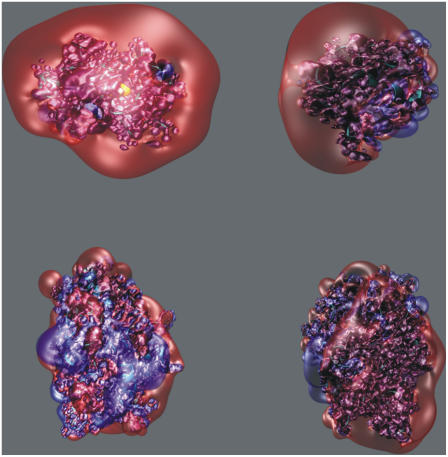
The [FeFe] hydrogenases HydA1 and HydA2 in the green alga Chlamydomonas reinhardtii catalyze the final reaction in a remarkable metabolic pathway allowing this photosynthetic organism to produce H(2) from water in the chloroplast. A [2Fe-2S] ferredoxin is a critical branch point in electron flow from Photosystem I toward a variety of metabolic fates, including proton reduction by hydrogenases. To better understand the binding determinants involved in ferredoxin:hydrogenase interactions, we have modeled Chlamydomonas PetF1 and HydA2 based on amino-acid sequence homology, and produced two promising electron-transfer model complexes by computational docking. To characterize these models, quantitative free energy calculations at atomic resolution were carried out, and detailed analysis of the interprotein interactions undertaken. The protein complex model we propose for ferredoxin:HydA2 interaction is energetically favored over the alternative candidate by 20 kcal/mol. This proposed model of the electron-transfer complex between PetF1 and HydA2 permits a more detailed view of the molecular events leading up to H(2) evolution, and suggests potential mutagenic strategies to modulate electron flow to HydA2.
Figures
Similar articles
-
Hydrogenase/ferredoxin charge-transfer complexes: effect of hydrogenase mutations on the complex association.J Phys Chem A. 2009 Apr 23;113(16):4060-7. doi: 10.1021/jp810409z. J Phys Chem A. 2009. PMID: 19317477
-
Expression of two [Fe]-hydrogenases in Chlamydomonas reinhardtii under anaerobic conditions.Eur J Biochem. 2003 Jul;270(13):2750-8. doi: 10.1046/j.1432-1033.2003.03656. Eur J Biochem. 2003. PMID: 12823545
-
Genetic disruption of both Chlamydomonas reinhardtii [FeFe]-hydrogenases: Insight into the role of HYDA2 in H₂ production.Biochem Biophys Res Commun. 2012 Jan 13;417(2):704-9. doi: 10.1016/j.bbrc.2011.12.002. Epub 2011 Dec 8. Biochem Biophys Res Commun. 2012. PMID: 22177948
-
Evolution of Chlamydomonas reinhardtii ferredoxins and their interactions with [FeFe]-hydrogenases.Photosynth Res. 2017 Dec;134(3):307-316. doi: 10.1007/s11120-017-0409-4. Epub 2017 Jun 15. Photosynth Res. 2017. PMID: 28620699 Review.
-
Light-Driven H2 Production in Chlamydomonas reinhardtii: Lessons from Engineering of Photosynthesis.Plants (Basel). 2024 Jul 30;13(15):2114. doi: 10.3390/plants13152114. Plants (Basel). 2024. PMID: 39124233 Free PMC article. Review.
Cited by
-
Iron-sulphur protein catalysed [4+2] cycloadditions in natural product biosynthesis.Nat Commun. 2024 Jul 10;15(1):5779. doi: 10.1038/s41467-024-50142-1. Nat Commun. 2024. PMID: 38987535 Free PMC article.
-
Engineering photosynthetic organisms for the production of biohydrogen.Photosynth Res. 2015 Mar;123(3):241-53. doi: 10.1007/s11120-014-9991-x. Epub 2014 Mar 27. Photosynth Res. 2015. PMID: 24671643 Free PMC article. Review.
-
Characterization of the key step for light-driven hydrogen evolution in green algae.J Biol Chem. 2009 Dec 25;284(52):36620-36627. doi: 10.1074/jbc.M109.053496. Epub 2009 Oct 21. J Biol Chem. 2009. PMID: 19846550 Free PMC article.
-
Complex Multimeric [FeFe] Hydrogenases: Biochemistry, Physiology and New Opportunities for the Hydrogen Economy.Front Microbiol. 2018 Dec 4;9:2911. doi: 10.3389/fmicb.2018.02911. eCollection 2018. Front Microbiol. 2018. PMID: 30564206 Free PMC article. Review.
-
Crystal structure and biochemical characterization of Chlamydomonas FDX2 reveal two residues that, when mutated, partially confer FDX2 the redox potential and catalytic properties of FDX1.Photosynth Res. 2016 Apr;128(1):45-57. doi: 10.1007/s11120-015-0198-6. Epub 2015 Nov 3. Photosynth Res. 2016. PMID: 26526668 Free PMC article.
References
-
- Boucher, O., J. Haigh, D. Hauglustaine, J. Haywood, G. Myhre, T. Nakajima, G. Y. Shi, and S. Solomon. 2001. Climate change 2001: the scientific basis. In Radiative Forcing of Climate Change. V. Ramaswamy, editor. Intergovernmental Panel on Climate Change.
-
- Dalgaard, T., U. Jørgensen, J. E. Olesen, E. S. Jensen, E. S. Kristensen, D. Connor, I. Mínguez, T. H. Deluca, and S. E. Koonin. 2006. Looking at biofuels and bioenergy. Science. 312:1743–1744. - PubMed
-
- Brower, K. R., B. H. Davison, A. J. Ragauskas, R. Templer, T. J. Tschaplinski, and J. R. Mielenz. 2006. Measuring the efficiency of biomass energy. Science. 312:1744–1745. - PubMed
-
- Palmer, M. W., and M. Downing. 2006. Harvesting our meadows for biofuel? Science. 312:1745–1746. - PubMed
-
- Cleveland, C. J., C. A. S. Hall, R. A. Herendeen, N. Hagens, R. Costanza, K. Mulder, L. Lynd, N. Greene, B. Dale, M. Laser, D. Lashof, M. Wang, C. Wyman, R. K. Kaufman, T. W. Patzek, A. E. Farrell, R. J. Plevin, B. T. Turner, A. D. Jones, M. O'Hare, and D. M. Kammen. 2006. Energy returns on ethanol production. Science. 312:1746–1748. - PubMed
Publication types
MeSH terms
Substances
LinkOut - more resources
Full Text Sources
Other Literature Sources
Medical
